Wednesday, May 31, 2006

Cumberland Resources Ltd. (TSX: CLG; AMEX: CLG)

Cumberland Resources Ltd. is a Canadian mineral exploration and Development Company with interests in two gold projects (Meadowbank & Meliadine) located in Nunavut Territory, Canada.

www.cumberlandresources.com

Looking at the charts I think that something is up with Cumberland and you might want to put it on your watch list for a possible trade.

CLG, Cumberland Resources Ltd. daily chart

CLG, Cumberland Resources Ltd. long term chart

Labels:

Saturday, May 27, 2006

Market Vectors-Gold Miners ETF GDX GDM

The New Amex Gold Miners Index - GDM tracker is the Market Vectors-Gold Miners ETF GDX - by Van Eck Global.
Here are two charts of the GDM Index annotated with Elliott Wave Count(click to enlarge).

Related :
commodity wave counts
gold spot wave count
Elliott Wave Tutorial
GDX by Jack Chan


Market Vectors-Gold Miners etf GDX GDM


Gold Miners Index GDM , GDX

Labels: , ,

Thursday, May 25, 2006

GG, Gold Corp Inc. at 25% discount !

Put GG on your radar screen if it isn't already there. GG is usually leading gold mining stock with shallow pullbacks and quick recoveries.

Technically the weekly chart looks pretty good, the price is just above the 61.8% Fibonacci support level , the local low was higher then the 50% Fibonacci line. Trend line support is also present not far below the price. Defiantly a stock to follow if you are gold stocks trader / investor. – Off course all is up to the price of gold which I think just organizing itself after an important [e] bottom. Interested about commodity charts analysis? – see commodity charts blog.

GG, Gold Corp Inc. weekly chart

*$$$$$$$$$$$$$$$$$$$$$$$$$$$$$$$$$$$$$$$$$$$$$$$$$$$$*


Monthly long term chart - click to enlarge (FireFox recommanded)

Goldcorp Inc. TSE:G monthly chart

Labels: ,

Wednesday, May 24, 2006

Yamana Gold Inc. TSE:YRI , AMEX:AUY

Yamana had a terrific run of almost 1000% from its bear market bottom of 1.25$ to 13.70$ (Canadian Dollar). Yamana Gold Inc. is also trading as AMEX: AUY.
I have annotated the chart with Elliott wave count and two sets of Fibonacci lines, one set from "THE" bottom to [c] top and the other one from the latest [b] bottom to the [c] top. This is a weekly chart and the RSI and PPO are both in a down trend. For Elliott Wave Free yet excellent tutorial see EWI (might need registration).

If you want to suggest your favorite gold , silver metal stock for review - let me know.

You can click on the chart below to enlarge:

Yamana Gold Inc. TSE:YRI weekly chart

Labels: , ,

Tuesday, May 23, 2006

Pan American Silver Corp. NASDAQ : PAAS

PAAS retraced 61.8% of the latest move up and seems to have support at the Fibonacci 61.8% support level, along a slight uptrend trend line. Pan American Silver is a Component of the XAU Index.

See possibly related previous PAAS posts.

See my latest Spot silver technical analysis.

Pan American Silver Corp. NASDAQ : PAAS weekly chart

Labels: ,

Monday, May 22, 2006

AMEX Launches New Gold Miners ETF GDX - by Van Eck Global

Market Vectors-Gold Miners ETF is US First and Only ETF Offering Broad Exposure to Gold-Mining Companies.


NEW YORK--(BUSINESS WIRE)--May 22, 2006--The American Stock Exchange® (Amex®), together with Van Eck Global, today announced the launch of the Market Vectors-Gold Miners ETF (the "Fund"). Now available for trading on the Amex under the ticker symbol GDX, this new exchange-traded fund (ETF) is designed to track the performance of the Amex Gold Miners Index (Amex: GDM - News) and is the first and only exchange-traded fund in the U.S. that offers investors broad exposure to the gold-mining equity market.

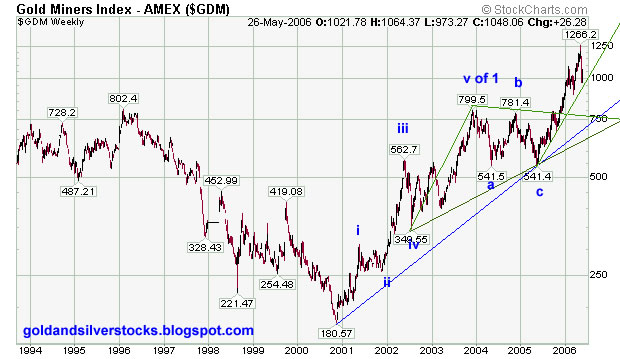
The Amex Gold Miners Index currently has 44 constituents, exceeding the scope of any other gold-mining-oriented index. The Index seeks to provide a balanced, diversified approach by including a comprehensive range of small, mid-sized and large companies from around the globe. The Amex Gold Miners Index was created by Amex in 2004 and is back-tested to September 1993.

While there are currently two exchange-traded funds on the market providing direct exposure to gold bullion, the Market Vectors-Gold Miners ETF is the nation's first and only exchange-traded fund to provide exposure to gold-mining shares.

"The American Stock Exchange is delighted to partner with Van Eck Global to bring this exciting new ETF to the marketplace," said Cliff Weber, Senior Vice President of the Amex's ETF marketplace. "Van Eck Global is a respected leader in offering gold-mining investment products, and the Amex is extremely pleased to have been selected to list their first ETF, which is a welcome addition to the Amex family of innovative products."

The current bull market in gold is now in its fifth year. "That is an extraordinary milestone," said Joseph Foster, who has been involved in the management of various Van Eck gold funds since 1996. "We at Van Eck believe that the vulnerability of the U.S. dollar, the twin deficits and other financial imbalances could lead to economic stress that supports a continued positive view on gold-related investments. The Market Vectors-Gold Miners ETF is designed for investors looking for the traditional diversification benefits of gold-related investments as well as the liquidity that intra-day trading access provides," Mr. Foster said.

Investors are becoming increasingly aware of the diversification benefits associated with gold and other commodity-related investments. "We believe that financial advisors and their clients will benefit from innovative ways to gain exposure to these markets," said Jan van Eck, Executive Vice President of Van Eck Global. "This new ETF underscores our long-standing commitment to commodity-related asset classes by providing a more diverse range of gold-related investment tools to the financial community."

Who Should Invest in the Market Vectors-Gold Miners ETF?

This ETF is designed for investors (institutions, hedge-fund and mutual-fund portfolio managers, as well as individual investors) seeking broad exposure to gold-mining shares. Stocks of gold-mining companies can be an effective way to leverage changes in the price of bullion. The Market Vectors-Gold Miners ETF is suitable for long-term investments; the Fund may also be sold short, thereby acting as a speculative hedging investment.

Van Eck Global is a pioneer and industry leader in commodity-related investment vehicles. Van Eck has been investing globally for more than fifty years and has been managing gold-related investments since 1968, when it introduced the nation's first gold-mining-oriented mutual fund. In addition to the Market Vectors-Gold Miners ETF, the Firm offers gold- and commodity-oriented mutual funds, variable insurance trust funds, institutional accounts and hedge funds.

The specialist for the Market Vectors-Gold Miners ETF is Goldman Sachs Execution & Clearing, L.P.

source


See also : Van Eck Seeks SEC Approval for Gold Shares ETF

Gold Market News and charts


GDM , GDX Market Vectors-Gold Miners ETFchart

Labels: , ,

Sunday, May 21, 2006

Uranium & Titanium Stocks: CCJ , TIE

CCJ Cameco Corporation (NYSE) is the world’s largest, low-cost uranium producer accounting for 20% of the world’s uranium production. CCJ mining and conversion facilities in North America provide fuel to the western world’s nuclear power plants. Through a partnership, CCJ also generate clean electricity of about 1,000 MW from a nuclear facility in Ontario. cameco.com

CCJ Cameco Corporation weekly chart

CCJ Cameco Corporation daily chart


************************************************


TIE Titanium Metals Corp (NYSE) - TIMET is the world's largest supplier of high quality titanium metal products. timet.com

TIE Titanium Metals Corp weekly chart

Titanium Metals Corp daily chart

Labels: , , ,

Tanzanian Royalty Exploration TRE , TNX

Off course all gold, silver; metals mining stocks are greatly dependent on the price of the metals. However TRE presents a very interesting business model which is worth learning for education purpose. TRE – Tanzanian Royalty Exploration (formerly: TAN RANGE EXPLORATION CORP) owns assets at Lake Victoria greenstone belt of Tanzania, for more details see Tanzanian Royalty website

Listed TSX:TNX , AMEX:TRE

Jim Sinclair the Chairman, CEO & Director runs the most famous jsmineset.com

TRE @ Sec.gov


Monster run, sharp correction and a bounce of a trend line:

Tanzanian Royalty Exploration TRE daily chart

Tanzanian Royalty Exploration TRE weekly chart

Tanzanian Royalty Exploration TNX monthly chart

Labels: , ,

Saturday, May 20, 2006

Few Gold, Silver stocks charts for the weekend

Silver Wheaton Corp.(NYSE:SLW)

The SLW label at the bottom of the post will take you to possibly related Silver Wheaton previous posts.

SLW @ Google Finance

SLW @ Yahoo Finance

Silver Wheaton weekly chart , Fibonacci support levels. If SLW is not oversold I don't know what it is... 50% hair cut.

slw chart


**************************************

Meridian Gold Inc. (NYSE:MDG)

Meridian Gold Inc. SEC reports

MDG @ Yahoo Finance

MDG @ Google Finance

Meridian Gold Inc. weekly chart Elliott wave count

mdg chart


***************************************

Gold Fields Limited (ADR) (NYSE:GFI)


GFI @ Google Finance

GFI @ Yahoo Finance


Gold Fields weekly chart, Fibonacci support levels

gfi chart


*************************************

Labels: , , , ,

Friday, May 19, 2006

Indonesia Supreme Audit Board calls for review of Freeport-McMoRan (FCX) contract

The risks...

JAKARTA (XFN-ASIA) - The Supreme Audit Board (BPK) is recommending a government review of its contract with US-based PT Freeport Indonesia as the current one does not maximize the revenue potential from its Papua copper and gold mine, Koran Tempo reported, quoting a BPK official.

'Review Freeport's royalty payment and fixed payments,' BPK member Baharuddin Aritonang was quoted as saying what the recommendation was.
Tempo said a BPK study covering 2004 and the first half of 2005 found that Freeport paid its royalty based on quarterly average prices, against accounting principles which require the use of prices per transaction.

This practice caused the state a potential revenue loss of 2.23 mln usd and a further 369,490 usd in unpaid royalty for 2003 and 2004, the report said.
BPK also found that Freeport's contract does not include sulphur as a by-product, causing a potential revenue loss of 14.4 mln usd.

Additionally, the audit agency found that Freeport has sold its copper concentrate to Glencore AG at below-market prices. This led to a potential tax revenue loss of 5.9 mln usd, Tempo said.
BPK's report comes as the government is studying Freeport's operation amid calls for the mine to be shut down as it does not benefit the local community.

Freeport has also been accused of pollution and human rights abuses, which the company has denied. - source

Freeport-McMoRan Copper & Gold Inc.(NYSE:FCX) daily chart


Labels: ,

Miramar Mining Corporation (AMEX: MNG), (TSX: MAE)

Miramar Mining Corporation - Canadian gold company - Yellowknife, Hope Bay gold mines operations in Canada.

http://www.miramarmining.com

Miramar Mining Corporation (TSX: MAE) daily chart


Miramar Mining Corporation (TSX: MAE) weekly chart

Miramar Mining Corporation (TSX: MAE) monthly chart

Labels:

Mines Management, Inc. (AMEX: MGN)

Mines Management, Inc., MGN - US mineral exploration and Development Company. MGN owns the Montanore deposit (Silver and Copper) which is located in northwestern Montana. Founded in 1947.

http://www.minesmanagement.com

Mines Management, Inc.(AMEX: MGN) daily chart

Mines Management, Inc.(AMEX: MGN) weekly chart

Mines Management, Inc.(AMEX: MGN) monthly chart

Labels:

Tuesday, May 16, 2006

HUI - Amex Gold Bugs Index Elliott Wave Count

Here are some HUI - Amex Gold Bugs Index charts. The charts are annotated with Elliot wave's counts, Fibonacci support lines, moving averages, trend lines and other technical indicators. To put it simply: It is my opinion that the HUI is close or already had bottomed. Like Gold I think that the HUI will go much higher, however I think that at some point and under some circumstances the price of gold and / or the price of silver will outperform the HUI index.

HUI logarithmic weekly chart, bear market bottom to date - click on the chart below to enlarge:


HUI linear weekly chart, bear market bottom to date - click on the chart below to enlarge:


HUI daily chart - one year


HUI daily chart - three month


  • For Elliott Wave analysis I highly recommend the book: Elliott wave principle.
  • See previous HUI Posts
  • IF you need a Free Real time quotes and charts for Gold, Commodities, Forex, Indices & Stocks (registration is required) try ADVFN
  • For viewing online charts, images and pictures I highly recommend the FireFox browser.

Labels: ,

TSX Group Announces Global Gold Index At New York Gold Show

MAY 15, 2006 (NEW YORK CITY) – TSX Group and Standard & Poor’s, the leading global provider of independent research, ratings and indices, today announced plans to create the world’s first Global Gold Index.

At the New York Hard Assets Investment Conference, TSX Group officials provided reporters with details on the new index. The Conference, one of the largest in the U.S., caters to mining professionals and international issuers. The show also attracts top mining analysts, fund managers, investment specialists and financiers from around the world.

The new S&P/TSX Global Gold Index, which will be based in Canada, will track leading gold mining companies from around the globe. Further details and a list of issuers to be included in the new index will be released by Standard & Poor’s by the end of 2006.

TSX Group is home to approximately 60% of the world's public mining companies and Canada has the world's largest mining analyst community that covers issuers on both Toronto Stock Exchange and TSX Venture Exchange. "Our exchanges have become the world's leading markets for raising equity capital for mining and as a result we attract numerous international mining participants," said Richard Nesbitt, CEO of TSX Group. "There is great value for mining issuers in a TSX listing. Mining issuers that list here tap into deep capital pools and there is extensive mining expertise in our market - from analysts, investment bankers, to investors.”

And mining companies from around the globe continue to come to TSX Group exchanges. This year there have been a total of 29 new mining listings on the exchanges. In aggregate, these new listings bring an additional $2.03 billion to the value of mining securities listed on TSX Group exchanges. The TSX's mining sector is home to 1198 listed mining companies with a quoted market value of over $259 billion.

Source: TSX.COM


If you need a Free Real time quotes and charts for gold, commodities, forex and stocks (registration is required) try ADVFN

Labels: ,

Wednesday, May 10, 2006

Global Gold Hedge Book Q1 2006

  • Q1 2006 Hedge Impact declines 5.0 Million Oz to 48.2 Million Gold ounces.
  • The global gold hedge book declined was the largest seen for three years, and comes after a period of slowing dehedging.
  • The decline was almost all due to Barrick (ABX) dehedging (4.7 Million Gold ounces).
  • 2006 dehedging forecast revised to 11.7 Million gold ounces.
  • The Global Gold Hedge Book prepared by Mitsui Global Precious Metals , Haliburton Mineral Services & Virtual Metals Research. - link


Global Gold Hedge Book Q1 2006

Labels:

Barrick Gold Corp. (NYSE: ABX) chart update

Barrick Gold Corp. (TSX: ABX) (NYSE: ABX) (LSE: BGD) (PARIS: ABX) (Swiss: ABX) the largest gold miner is doing pretty good lately. Barrick have closed significant amount of its hedging position and apparently rewarded by investors. Technically, Barrick broke above the upper diagonal resistance trend line on good volume. Most likely it will consolidate around current levels (+/- 5%) before moving higher.

See previous / related Barrick Gold Corp, ABX Posts


See Spot gold and silver charts, analysis , commentary and news

Barrick Gold Corp. (TSX: ABX) (NYSE: ABX) (LSE: BGD) (PARIS: ABX) (Swiss: ABX) chart

Labels:

Tuesday, May 09, 2006

Gold, Silver, Metals Mining Exploration & Political Risk reports

  • Special report on world mining exploration trends prepared by Metals Economics Group (MEG). The report examines the nonferrous exploration activities of all mining companies worldwide. The report Includes summary of trends in exploration spending and an industry-wide analysis of allocations by location, target, and stage of development. - Link

  • Annual Survey of Mining, Exploration, Development and Mining consulting companies around the world. The report by the Fraser Institute is based on 322 companies and trying to asses the political risk for mining operations world wide. - Link

Labels:

Sunday, May 07, 2006

Van Eck Seeks SEC Approval for Gold Shares ETF

In the wake of the resounding success of gold bullion-backed ETFs, New York-based Van Eck Associates has filed a registration statement with the SEC for approval of the first U.S. ETF that would focus on gold and silver mining company stocks.

According to documents recently filed with the SEC, the objective of the Market Vectors ETF Trust is "to replicate as closely as possible, before fees and expenses, the price and yield performance of the AMEX Gold Miners Index."

The Gold Miners Index (GDM) only invests in companies with a capitalization greater than $100 million that have traded on an average daily volume of at least 50,000 shares over the past six months. The index includes 43 gold and silver companies. Among the companies listed on the GDM are major gold producers, such as AngloGold Ashanti Barrick, Freeport McMoRan, Gold Fields, Goldcorp, and Newmont. Among the junior gold miners, explorationists, and royalty companies on the GDM are Eldorado Gold, Meridian Gold, Randgold Resources, Crystallex,, Northern Orion, and Royal Gold. Silver miners and explorationists on the index include Apex Silver, Coeur d'Alene Mines, Hecla, Pan American Silver, and Silver Standard Resources.

Van Eck Associates has already experienced success in its Global Hard Assets Fund (GHAAX), which invested in energy and metals, and its International Investors Gold Fund (INIVX). Both funds are garnering high ratings from the Morningstar investment research firm.

Van Eck proposes to charge a total net annual fund operating expense of 0.55% for the Market Vectors ETF Trust. One of the major differences between investing in shares and holding gold bullion is taxes. Precious metals are classified as a "collectible," and are subject to higher taxes. However, mining shares tend to be more volatile than physical metal because of the higher risks associated with actually mining the ore. source


Amex Gold Miners Index (GDM) chart

Amex Gold Miners Index (GDM) chart

Labels: ,

Monday, May 01, 2006

Bema Gold Corporation - TSX / AMEX: BGO, AIM: BAU

Bema Gold Corporation is a gold producer with mines and development projects in Russia, Chile and South Africa. Bema operates the Julietta Mine in Russia, the Petrex Mines in South Africa, and is 50% owner of the Refugio Mine in Chile.

www.bema.com

Since the beginning of the second wave up ( May 2005) the stock price tripled.
In my opinion this is the second major wave up (Elliott Wave III) for Gold, Silver and PM stocks. If you are new to Elliott waves and interested – see this Free Elliott wave guide by EWI. If you want to know more I recommend this book and subscription to EWI service ( 30 days Free trail)


Bema Gold Corporation BGO chart


Bema Gold Corporation AMEX BGO weekly chart

Labels: