Saturday, July 29, 2006

HUI – Gold Bugs Index Technical Update

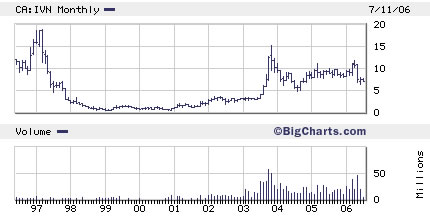
The HUI is a good proxy for the gold miners. Usually the HUI is outperforming the rest of the gold miners Indices ( XAU, GDM , GOX). Miners which are components of this index tend to have little gold hedge or none, thus providing investors with the full opportunity to enjoy this roaring global gold bull market.

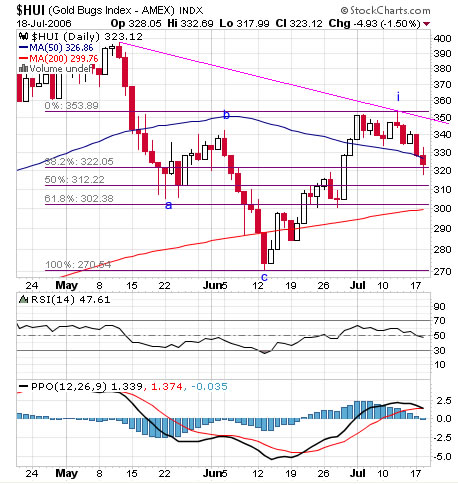
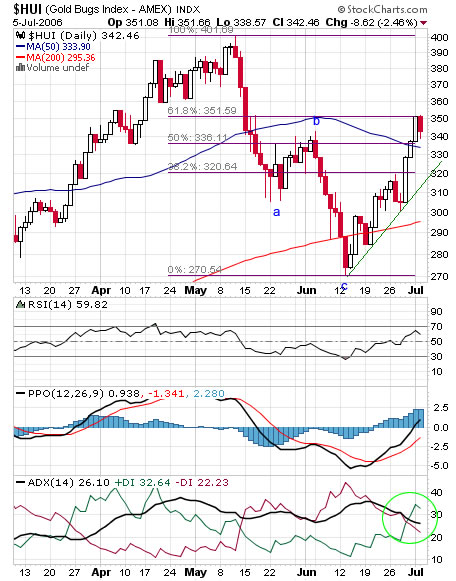
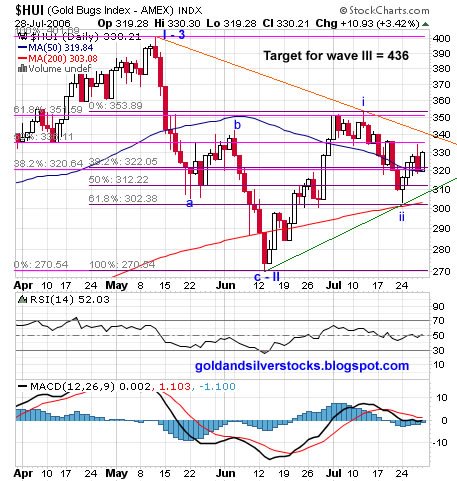
Technically, as noted at my last update, the HUI completed ABC correction wave (wave II – 3), followed by minor up wave ( i- III) and then a minor wave down ( ii – III). Currently The HUI is at the beginning of wave (iii – III) which is part of a larger degree third wave up – This is a triple three wave up and as such it encapsulate a potential for extremely large gains on the upside. This is the time you want to be fully long all good quality things gold and don’t be quick to take profit.

Below is HUI daily chart annotated with 2 sets of Fibonacci retracement lines, pink set from top ( I – 3) to bottom (c- II) and purple set from bottom ( c- II) to minor top (i – III) the HUI is just above the 38.2% on both sets and the 50 DMA – this should provide good support. RSI above 50 , MACD flat above zero.

I repeat, this is the time to be fully long on gold and all of your favorite gold stocks as the potential for massive gains is extremely high in my opinion.

HUI – Gold Bugs Index chart

Labels: , ,

Tuesday, July 25, 2006

GGP - Gold Market Update

Gold Global Perspective : Gold Market Update ++

Labels:

Wednesday, July 19, 2006

HUI, GDX Technical Update

Same analysis for both charts, following the completion of A-B-C correction (wave 2) both the HUI and the Goldminer ETF (GDX) have just completed minor wave up (i) , minor wave (ii) is underway and should be terminated at one of the Fibonacci lines below current price. RSI trending down below 50 , PPO natural. Support at Fib lines and 200 DMA. Once the minor correction wave (ii) is over, expect a minor yet extended wave (iii) which will probably take both GDX and HUI higher to retest the all time highs. Remember - all is subject to the price of gold (POG) - see my latest gold price analysis.

HUI - gold bugs index chart


GDX - golminer etf chart

Labels: , , , ,

Sunday, July 16, 2006

AngloGold Ashanti (NYSE:AU)

A.G asked for a review of AngloGold Ashanti (NYSE:AU)

Anglogold is a giant mining company with worldwide operations. The stock is listed on several exchanges including New York, Johannesburg, Ghanaian, London and Australian stock exchanges, as well as the Paris and Brussels bourses.

Weekly Chart

Top labeled (1) at Q4 2003 followed by a year and a half A-B-C correction (wave 2 down) and a touch at the 200 weekly moving average (WMA). Anglo is currently in wave (3) up. The stock topped well before the gold indices, lost about 76.4% of the (i – 3) minor up wave progress and bounced from the 200 WMA.

Indicators – RSI stagnant just below 50, PPO still bearish below zero.

Support –Fibonacci lines below the current price.

Resistance – at Fibonacci lines above the current price and the Q1-2006 top.


AngloGold Weekly Chart


Daily chart

Rallied strongly lately from extreme oversold condition, 50 / 200 bearish DMA crossover.

Indicators – RSI trending down but still above 50, PPO above zero but seems to turn back down.

Support –Fibonacci lines below the current price.

Resistance – at Fibonacci lines above the current price and the and the pink downtrend line.


AngloGold Daily Chart


Labels: , ,

Wednesday, July 12, 2006

Ivanhoe Mines IVN

Ivanhoe Mines is a Canadian mining - exploration company with operations focused in the Asia Pacific region. Ivanhoe's core assets are its Oyu Tolgoi Project and the Nariin Sukhait Coal Project in southern Mongolia. Other operations include copper and gold exploration and projects in Mongolia , Myanmar, Kazakhstan and Australia.

See : www.ivanhoe-mines.com for more details.

Respectable fellow blogger Bill Cara mentioned IVN several times.


Ivanhoe Mines is trading at the Toronto stock exchange(TSE: IVN) and the New York Stock Exchange (NYSE: IVN)


Long term monthly chart

The stock was trading as high as 19$ (CAD)at Q1 1997 and as Low as 0.55$ at Q4 2000. 2003 was the best year for IVN investors – the stock had spectacular rally and topped at 15.30$. Since then the price performance was poor to say the least, while Copper and Gold are up sharply.

IVN long term chart


Weekly chart

The chart pattern is disordered indicating high risk, from pure technical perspective It belongs to the group of DROOY and KRY.

Price action – from 4.85$ to 12$ then it crashed through the 50 weeks moving average with a huge gap - and bottomed just 3 cents below the 76.4% Fibonacci level..

Indicators- RSI trending down below 50, PPO bearish crossover.

Support – the green trend line and the 76.4% Fib(6.54$). Resistance – the 200 WMA , the Fibs especially the 50% Fib area.

IVN chart


Short term daily chart

Again, huge gap > 1$ through the 200 DMA, relatively mild bounce to the 23.6% Fib line .

Indicators – RSI trending down below 50, PPO bullish crossover but still below zero, PPO histogram positive. Heavy resistance at Fib lines and 50 MA, breaking above the pink downtrend resistance will be bullish and might ignite a rally.


Ivanhoe chart


Would you like to suggest a mining / exploration stock for review? - email

Labels: ,

Thursday, July 06, 2006

HUI (AMEX Gold Bug Index) – Update

The HUI bottomed at 270.54 after a typical ABC correction then rallied to the 61.8% FIB, currently still above the 50 daily moving average, RSI trending up above 50, PPO bullish crossover, PPO histogram positive, ADX bullish crossover.
Given the quick recovery and some resistance at the 61.8% FIB we might see a bit of a consolidation at current level with good support at green uptrend line, 50 DMA, 200 DMA and the 38.2% FIB line. The HUI will be affected from both the price of gold and the general stock market. Use any weakness to accumulate your favorites gold and silver stocks.


HUI - AMEX Gold Bug Index Chart

Labels: , ,

Wednesday, July 05, 2006

Vista Gold Corp.- VGZ (AMEX / TSX)

bubble_watcher mentioned Vista Gold few days ago:

Vista Gold Corp.- VGZ (AMEX / TSX)
- based in Littleton, Colorado, evaluates and acquires gold projects with defined gold resources. Additional exploration and technical studies are undertaken to maximize the value of the projects for eventual development. The Corporation's holdings include the Maverick Springs, Mountain View, Hasbrouck, Three Hills, Wildcat projects, the F.W. Lewis, Inc. properties and the Hycroft mine, all in Nevada, the Long Valley project in California, the Yellow Pine project in Idaho, the Paredones Amarillos and Guadalupe de Los Reyes projects in Mexico, the Amayapampa project in Bolivia, the Awak Mas project in Indonesia and the Mt. Todd project in Australia.

http://www.vistagold.com

From the long term quarterly chart we can learn that Vista Gold was once 300$ stock (discounting 20:1 reverse split).

 Vista Gold long term chart


The 3 years weekly chart shows an Impressive rally (2.76$ - 9.99$) then a pullback to the 38.2% Fib line. RSI trending up , PPO trending up and PPO histogram still positive. The pullback did not damaged the bullish indicators.

Vista Gold weekly chart


Short term daily chart – A-B-C correction (9.99$ - 6.99$), (C>A), break up above the 50 DMA and the orange downtrend resistance. Currently trading above all relevant fib lines. RSI looking good and trending up, PPO trending up above zero, PPO histogram positive, ADX bullish. Not much resistance other then the 9.99$ high

VGZ daily chart

Labels: , ,