


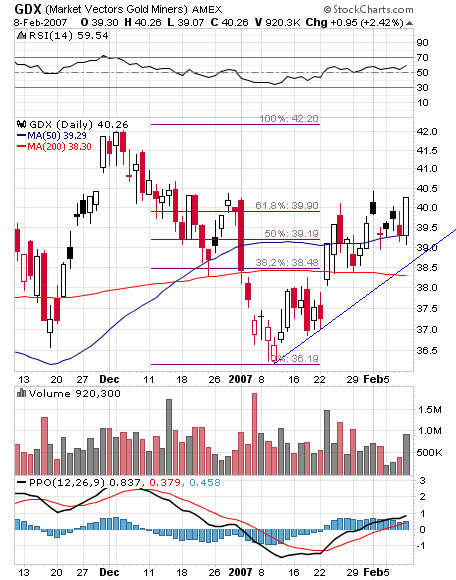
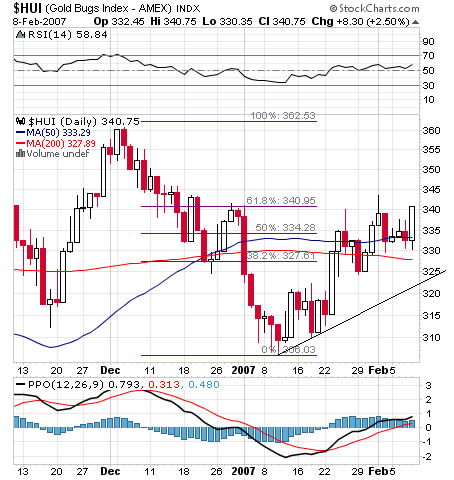
HUI and GDX charts update
The two charts looks almost identical, the price is above the 50 MA, The 50 MA is above the 200 MA, and RSI trending up above 50, PPO lines are above zero.
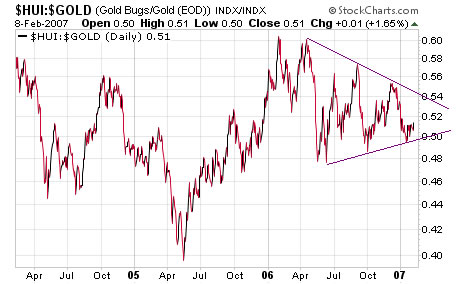
However, while gold recently climbed above its December top gold indices and silver did not. The HUI Gold ratio is trapped inside a contracting triangle formation. Overall the charts look bullish but the non confirmation implies caution.
posted by troy @ 2/09/2007
![]()
![]()
0 Comments:
Post a Comment
<< Home