Thursday, December 25, 2008

XAU is UP 100%

Since the October bottom the xau index is up 100% . Yes the market had been super volatile in recent months and the xau was down sharply to erase almost all of the first major bull wave gains. But still, it is amazing how quickly the gold and silver index recovered.

In my opinion this is a great bullish sign for precious metals and other commodities. While there is so much talk about deflationary spiral this tiny sector leads the way of recovery and show the market the great upside potential.


Labels:

Sunday, December 07, 2008

XAU Update

In the last several weeks the xau index consolidated around the lows and the technical situation is looking a bit better.

Support is around recent lows , resistance at around 140 then 180.

xau chart weekly

Labels:

Sunday, October 26, 2008

XAU Update

The XAU index lost most of it's bull market gains. During the last 8 years ( late 2000 to mid 2008) the xau climbed from a low of 41 to a high of 209 (~400%). Recently a major sharp and volatile decline took this index back to 63.5 (~70%). This is the worst decline since the 2000 bottom.

Whats next?

It is a fact that most of the bull market gains are gone , the XAU crashed through almost all the support levels and not much is left other then the late 2000 bottom (~41). In my opinion the first phase of the gold bull market is over , currently a bear market phase is underway. Its is possible that the bear phase might soon be over and a new multi year bull market advance should soon be underway.

Be patient!


xau weekly chart

xau monthly chart

Labels:

Wednesday, September 03, 2008

XAU chart update

The chart took a major hit along the metals. The gold and silver mining sector is down more then 30%.
Important cyclical low at 120. If metals goes higher the xau goes higher as well. It might be a good idea to be patient and wait for major bullish signals / setups.

xau chart

Labels:

Saturday, July 19, 2008

XAU Chart

The XAU gold and silver index reached a high of 206 points which is just 3 points below the March high.

There is an inverted head and shoulders bullish pattern , the head at ~163 points and the neckline at 195 points which gives a target of 227.

xau index

Labels: ,

Sunday, July 06, 2008

XAU Chart Update

The XAU Index almost reached 200 points or just 10 points lower then its March high. An aggressive profit taking followed but the chart structure looks healthy. Recent highs and lows are marked on the chart bellow. MA's , PPO and RSI are positive.

xau chart

Labels:

Monday, June 30, 2008

Positive XAU action

The gold and silver xau index has managed to surpass both April and May peaks(equals to August gold at 940$ and 960$). XAU is not far from it's March peak. Important cyclical bottoms 162 @ March and 172 @ June. As the gold bull market continue It is reasonable to assume that higher highs should follow.

xau chart

Labels:

Sunday, June 22, 2008

XAU Chart Analysis

The Philadelphia gold and silver index is still consolidating within a 50 points range (160 - 210). The 200 and 50 daily moving averages closing on each other, both downtrend and uptrend lines still valid.

Important cyclical lows : August 2007 , December 2007 and May 2008.

Important cyclical highs: March 2008, May 2008.


XAU index logarithmic daily chart

xau chart

Labels:

Sunday, May 18, 2008

XAU and XAU/Gold update

Dear readers ,

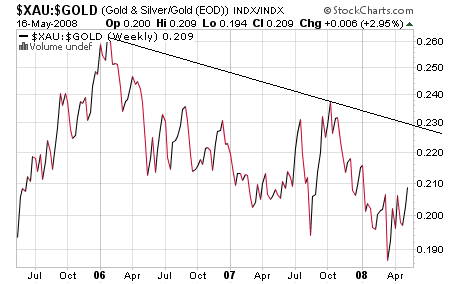
what can I say? , the price action of the XAU index and gold miners in general is similar to that of gold. Lately the XAU is trying to out perform gold as can be seen by the xau/gold ratio chart.

xau index chart

xau gold ratio chart

Labels: ,

Wednesday, August 22, 2007

XAU Index Update

Wild swings, ~30 points rally then a serious decline of ~40 points, currently recovering.

xau index daily


xau index weekly

Labels:

Tuesday, July 24, 2007

Partial Profit Taking

Gold & Silver stocks / indices had a huge rally as expected, currently extremely overbought on a daily chart. Take some profits and gradually enter after some kind of correction. Most likely in a week or two the overbought condition will work itself out.

xau chart

Labels:

Friday, July 13, 2007

XAU Weekly Chart

Our most reliable index for Elliott wave counts still remains the Philadelphia Gold and Silver index. Currently wave 3 of 3 of 3 is underway, this is a rare bullish situation. Extended bullish move is expected, be careful of extra volatility. The count remains valid as long as the XAU remains above 130.83.


xau chart

Labels:

Monday, May 07, 2007

XAU Chart

Given recent strength in gold prices the performance of the Philadelphia gold and silver stocks index is not that impressive. Other gold & silver mining indices haven't done much better.

The XAU: GOLD ratio continue to consolidate around recent lows.

Lets see what come next.


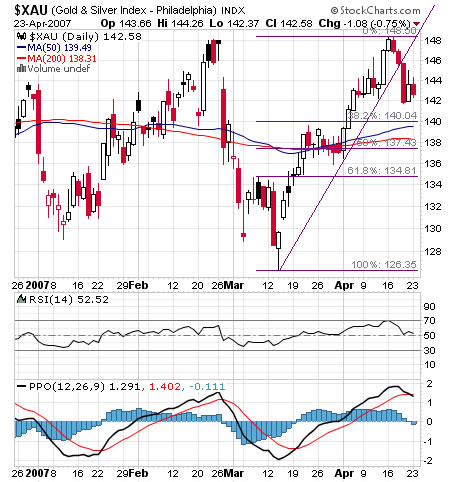
Chart annotated with short term Fibonacci levels and uptrend line ( short term support).

XAU Chart

Labels:

Monday, April 23, 2007

Few notes on XAU & HUI

Currently Gold and Silver stocks indices seem to consolidate the March – April gains. Overall the picture is positive as higher high was printed for XAU & HUI.

xau chart

hui chart


XAU continue to lead in terms of options volume and open positions.

HUI leads in terms of price (less hedged). RSI is higher.

hui xau ratio


Volume is important and the XAU will dictate the Elliott wave count. XAU tends to print lower lows (wave c vs. wave a) while HUI is confused with truncated correction waves.

xau chart


hui chart


XAU / Gold & HUI / Gold Ratios – still underperforming, triangle formation – no breakout yet.

hui gold ratio

xau gold ratio

Patience is indeed required as S.M Himes posted.

It is possible that indices and gold both forming an Egg pattern. I will post more about the Egg pattern on the Gold Global Perspective section.

Labels: ,

Tuesday, April 10, 2007

Update

Seems like the HUI might start some kind of correction to its 50 daily moving average area.

By options expiration I think the XAU will be somewhere between 137.50 & 140. Off course all is dependent on what will happen with the metals, USD, Crude Oil etc.

Labels: ,

Tuesday, March 13, 2007

Mixed Bag

Well, I'm certainly not a general equity bull and hence not surprised of the recent (ongoing?) global equity market drop. I did also forecast a certain amount of weakness for metals, commodities and precious metals shares. So anyone following my posting got several warnings.

However when I examine the gold, silver, precious metals stocks and various ratio charts the picture is mixed.

Some bearish signs: major miners (which are heavily weighted into gold mining indices) Barrick Gold (ABX), Newmont Mining (NEM), Goldcorp (GG) are making new lows for 2007 and the charts look like they can slide lower. XGD the Canadian gold miners ETF, $XAU – both closed at a new low for 2007

Some bullish signs: The gold & silver charts do not look that bad (yet), the HUI continue to outperform the heavy hedged XAU. Some juniors are outperforming as Stacy M. Himes Posted.

I favor holding good long term gold, silver and precious metals shares positions, be in a wait and see position, do not capitulate! , do not seat and wait like a duck for your stops to be taken, don't be shy to take partial profits, If you can't stand the volatility then decrease your positions.

Good Luck

Labels: ,

Sunday, February 25, 2007

Gold Indices Review

Despite of recent spike in the price of gold and silver, gold indices continue to under perform.

Of all four gold indices I'm tracking (XAU, HUI, GDX(GDM), GOX) the XAU is senior both in terms of option trading volume and chart history.

Short term trend line support around 137, recent short term cyclical low at 129.
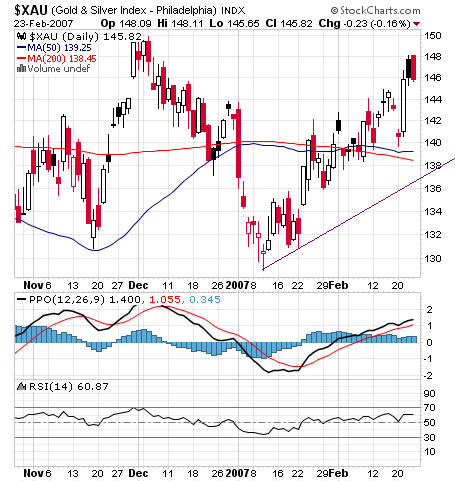
xau daily chart

xau weekly chart

the PHLX gold and silver index is calculated since early 1979 ( =100)
xau long term chart


GDX(Market Vectors Gold Miner) is the only gold miners ETF trading at the US, tracks the GDM (AMEX Gold Miners Index). Last Friday the GDX managed to trade above its January top but closed under. Short term trend line support around 40.25, recent short term cyclical low at 36.19.

gdx daily chart

GOX (CBOE Gold Index) , Chicago is a major center for gold, silver and other futures trading. Short term trend line support around 148, recent short term cyclical low at 133.45.
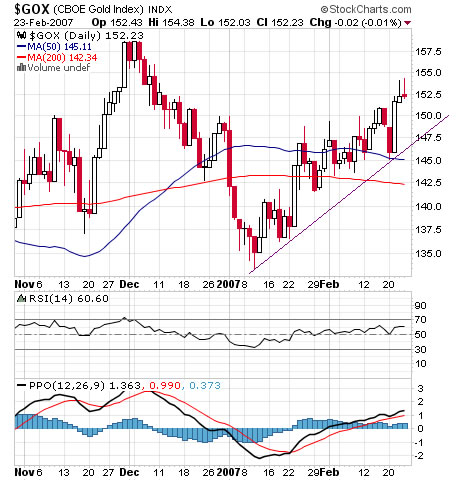
gox daily chart

HUI(AMEX Gold Bugs Index) is favored for the reason its components are relatively unhedged. Short term trend line support around 331, recent short term cyclical low at 306.
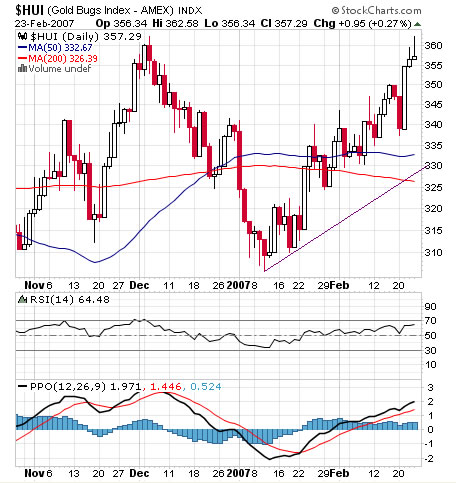
hui daily chart

Note that the HUI is already up several hundreds percents since the bear market bottom.
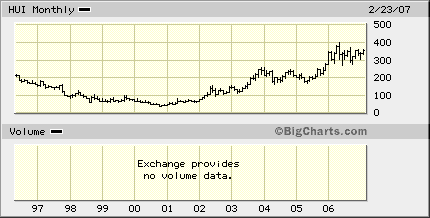
hui long term chart

Generally, currently I do not favor initiating any new gold/ silver / PM's positions. On the other hand - I think that a pullback might find support at short term uptrend lines with but holding above recent cyclical low is much more important for the long term bullish picture.

Labels: , , , ,

Saturday, September 16, 2006

Gold Indices - XAU , HUI - Fibonacci update

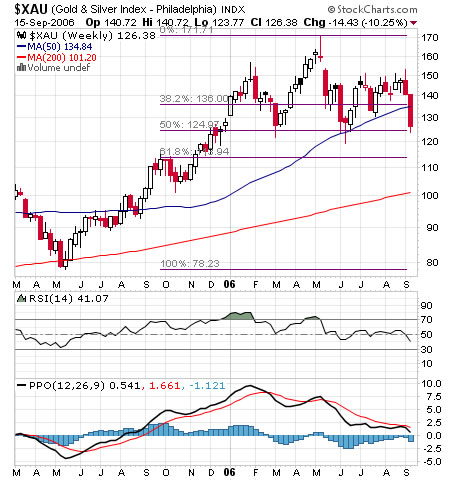
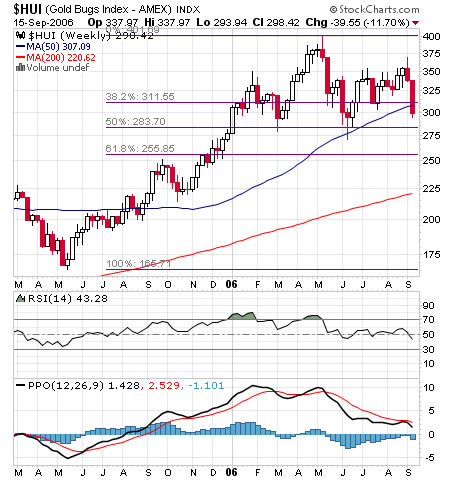
A) XAU continue to under perform the HUI.

B) Important price levels:

i) June lows.

ii)Fibonacci 50% and 61.8$ retracemnt lines.

xau chart


hui gold bug index chart

Labels: , ,

Tuesday, August 29, 2006

XAU index Fibonacci chart

Most markets (including gold, silver and mining stocks) have been range bound lately. Situations like this often resolve in powerful breakout one way or another…

Be prepared!

XAU gold and silver stocks index - chart

Labels: ,

Sunday, June 18, 2006

Gold vs. Gold Stocks, GOLD/XAU Ratio

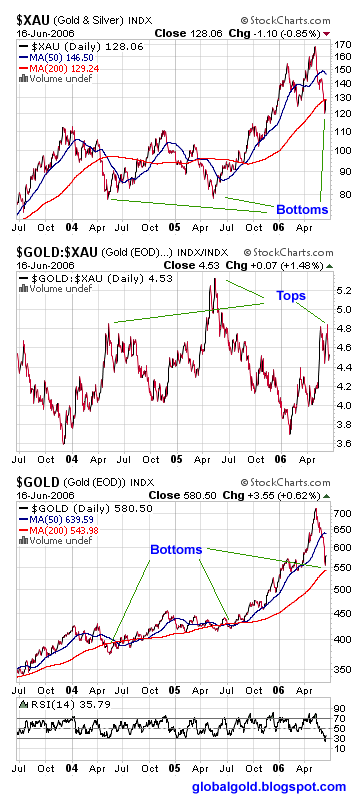
Gold Stocks as a group or an index tend to be more volatile then gold. When gold is going up gold stocks tend to go up faster, when gold is correcting downwards , gold stocks get hit harder. Overall Gold & gold indices are well correlated. This can be easily seen on the first chart below which presents the last 3 year performance of Gold, The Philadelphia Gold & Silver Index (XAU) and the ratio between them. When the Gold / XAU is trending down both Gold & the XAU Index are trending up and visa versa.

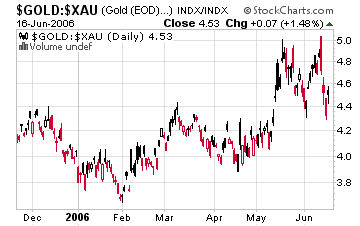
The usefulness in charting the GOLD/XAU ratio is dual – the ratio can sometimes give an early sign and confirmation of bottom or top for the Gold market complex. Looking at the second chart below (Seven month $GOLD:$XAU daily candle chart) you can see a relatively clear double top pattern which implies that the gold market have bottomed.

Please note: The GOLD/XAU Indicator have served me in the past but I do expect it to stop working sometimes in the future - Gold and Silver will outperform the stocks at some point. Remember that gold stocks are highly dependent on the price of gold while the opposite is not true.

I choose the Philadelphia Gold & Silver Index (XAU) for the reason it is the most popular - traded gold stocks index. The same conclusions are generally true for other gold indices like the GDM (GDX ETF) – AMEX Gold Miners Index, the HUI – AMEX Gold Bugs Index and the GOX – CBOE Gold Index.

By the way and In case you wanted to know my favorite gold stock is the GLD.

Gold vs. Gold Stocks

GOLD/XAU Ratio

Labels: ,