Sunday, February 25, 2007

Gold Indices Review

Despite of recent spike in the price of gold and silver, gold indices continue to under perform.

Of all four gold indices I'm tracking (XAU, HUI, GDX(GDM), GOX) the XAU is senior both in terms of option trading volume and chart history.

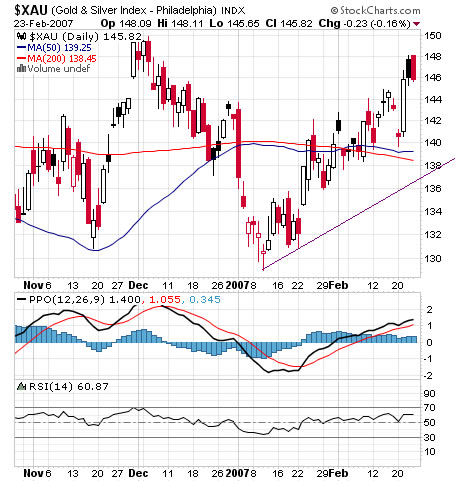
Short term trend line support around 137, recent short term cyclical low at 129.

xau daily chart

xau weekly chart

the PHLX gold and silver index is calculated since early 1979 ( =100)
xau long term chart


GDX(Market Vectors Gold Miner) is the only gold miners ETF trading at the US, tracks the GDM (AMEX Gold Miners Index). Last Friday the GDX managed to trade above its January top but closed under. Short term trend line support around 40.25, recent short term cyclical low at 36.19.

gdx daily chart

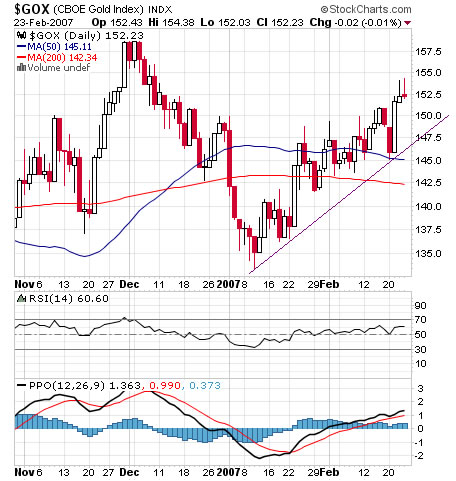
GOX (CBOE Gold Index) , Chicago is a major center for gold, silver and other futures trading. Short term trend line support around 148, recent short term cyclical low at 133.45.
gox daily chart

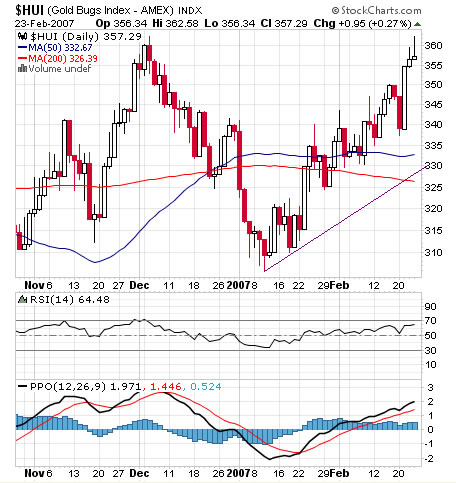
HUI(AMEX Gold Bugs Index) is favored for the reason its components are relatively unhedged. Short term trend line support around 331, recent short term cyclical low at 306.
hui daily chart

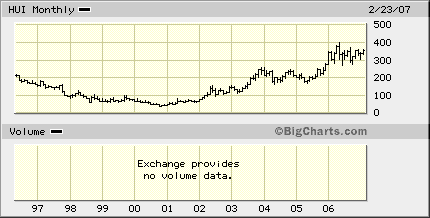
Note that the HUI is already up several hundreds percents since the bear market bottom.
hui long term chart

Generally, currently I do not favor initiating any new gold/ silver / PM's positions. On the other hand - I think that a pullback might find support at short term uptrend lines with but holding above recent cyclical low is much more important for the long term bullish picture.

Labels: , , , ,

Friday, February 09, 2007

HUI and GDX charts update

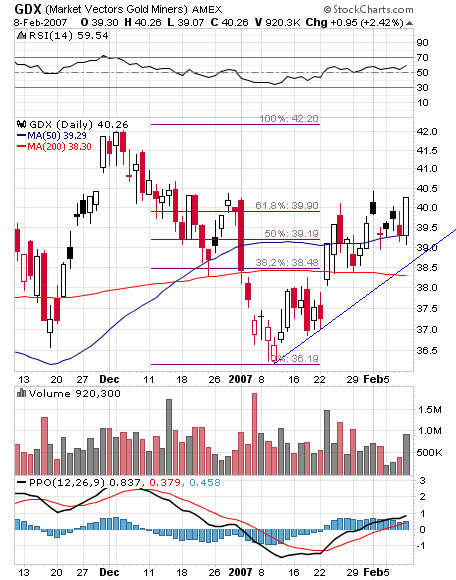
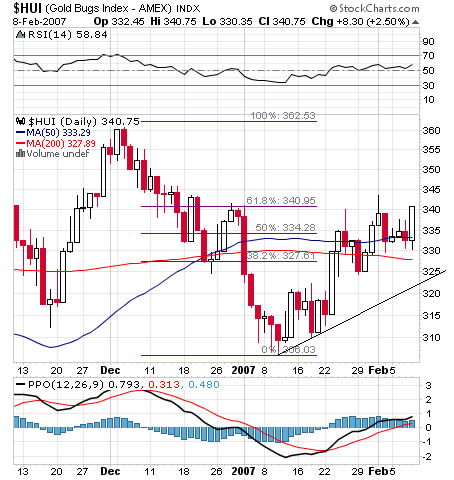
The two charts looks almost identical, the price is above the 50 MA, The 50 MA is above the 200 MA, and RSI trending up above 50, PPO lines are above zero.
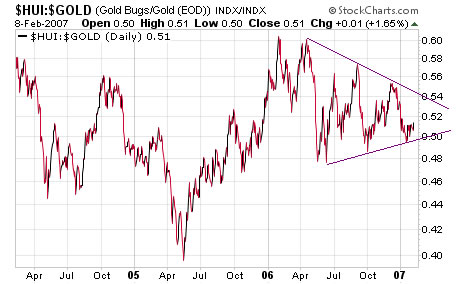
However, while gold recently climbed above its December top gold indices and silver did not. The HUI Gold ratio is trapped inside a contracting triangle formation. Overall the charts look bullish but the non confirmation implies caution.


GDX chart

HUI chart

hui gold ratio chart

Labels: , , ,

Sunday, October 29, 2006

Gold Miners ETF

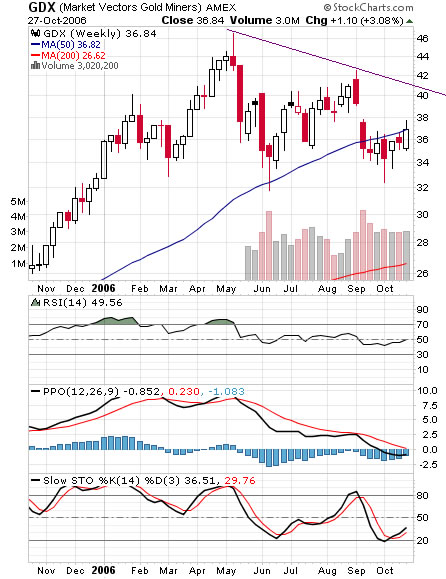
The GDX closed the week two cents above the 50 weekly moving average. RSI is a bit below 50, PPO indicator seems to be ready to turn back up , stochastic is crawling upward from oversold condition. Key resistance at diagonal line (purple line) could be challenged quite soon.


gdx chart

Labels:

Sunday, September 24, 2006

GDX – goldminers ETF Charts

GDX is currently the most diversified golminers trading instrument.

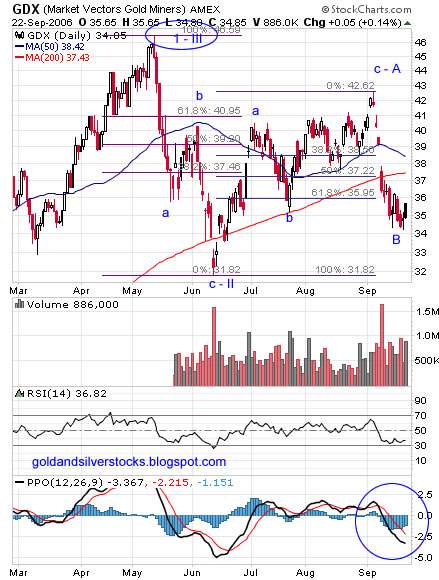
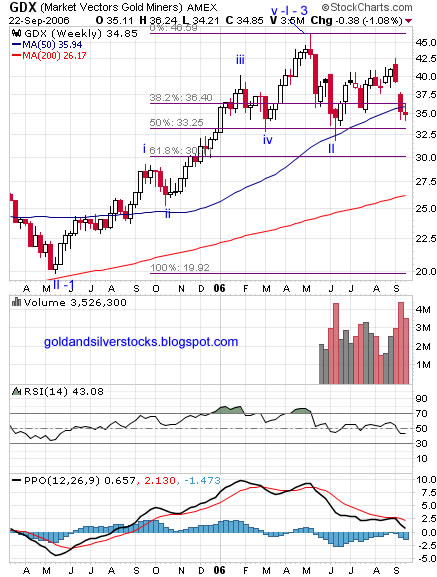
Technically the GDX is trapped between the May high (46.59$) and the June low (31.82$). I annotated the charts with Fibonacci support/ resistance levels and Elliott wave count. If the wave count is correct then the GDX will soon head back up and the last low (labeled B) should probably hold.

The PPO indicator on the daily chart is sowing signs of turning back up. On the Weekly chart the PPO is still above zero.

GDX – goldminers ETF daily Chart


GDX – goldminers ETF weekly Chart

Labels: , ,

Thursday, August 03, 2006

GDX – Gold Miners ETF

The GDX along the XGD is excellent trading / investment tool which enable both positive and negative diversified exposure to the gold mining industry.

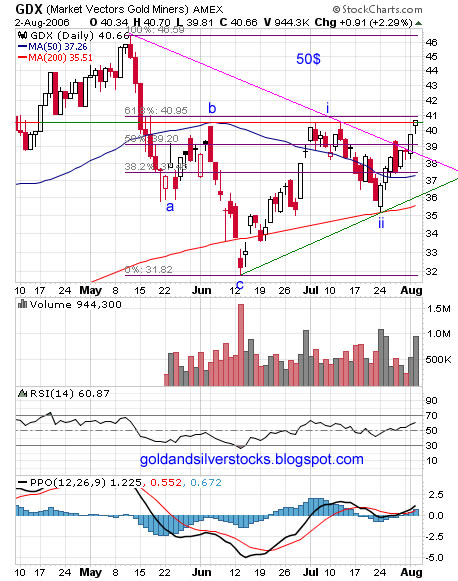
Technically, breakout above the diagonal pink resistance line (currently support), slight resistance at the 61.8% Fibonacci line. Inverted head and shoulders pattern with price target of 50$. For practical objectives the same analysis is good for other gold miners indices.

Technical indicators: RSI trending up above 50, PPO bullish crossover, positive PPO histogram.

Support : Fibonacci lines below the current price , pink and green trend lines.

Resistance: 61.8% Fibonacci line, 43$ and the May high.

GDX – Gold Miners ETF chart

Labels: , , ,

Wednesday, July 19, 2006

HUI, GDX Technical Update

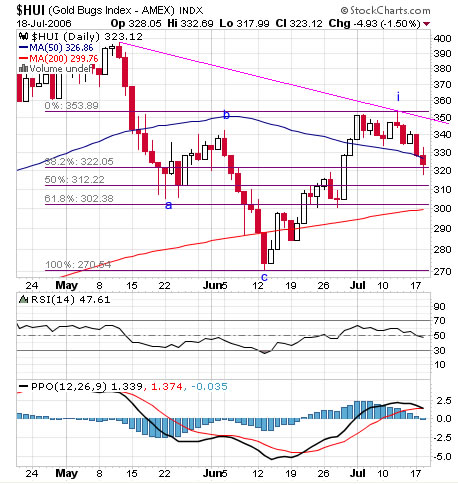
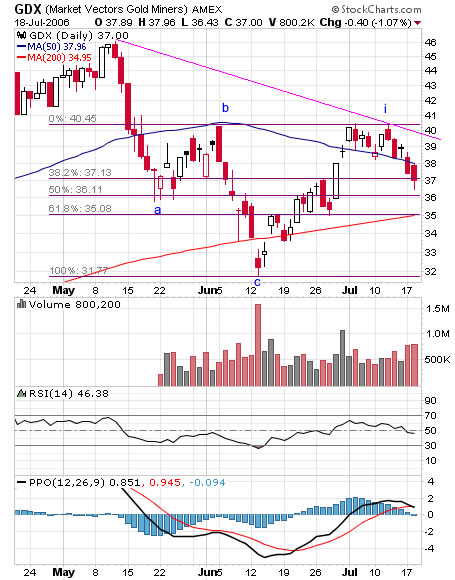
Same analysis for both charts, following the completion of A-B-C correction (wave 2) both the HUI and the Goldminer ETF (GDX) have just completed minor wave up (i) , minor wave (ii) is underway and should be terminated at one of the Fibonacci lines below current price. RSI trending down below 50 , PPO natural. Support at Fib lines and 200 DMA. Once the minor correction wave (ii) is over, expect a minor yet extended wave (iii) which will probably take both GDX and HUI higher to retest the all time highs. Remember - all is subject to the price of gold (POG) - see my latest gold price analysis.

HUI - gold bugs index chart


GDX - golminer etf chart

Labels: , , , ,

Wednesday, June 21, 2006

Gold Stocks ETF GDX & XGD

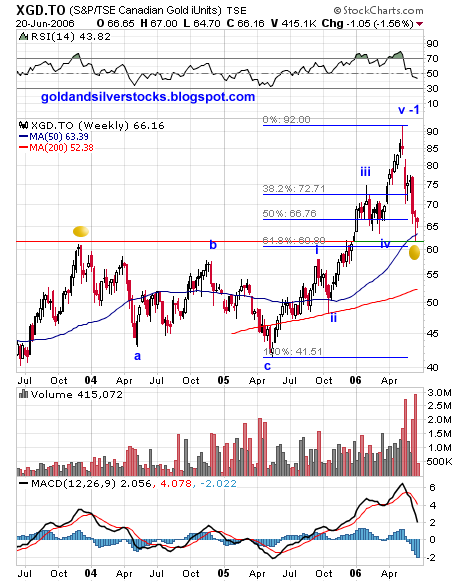
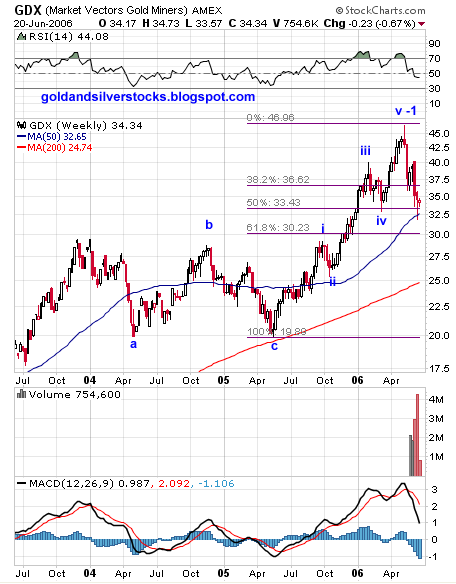
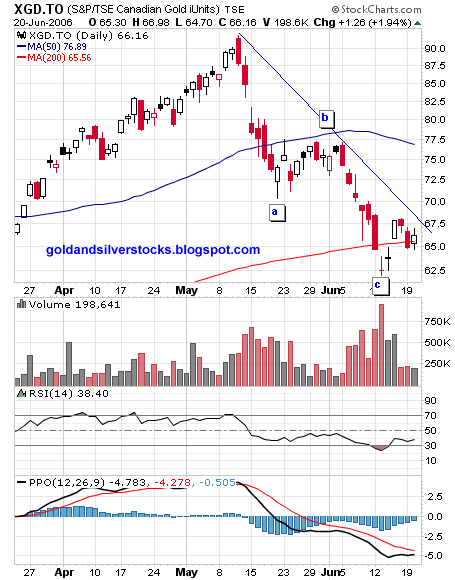
GDX is the Market Vectors Gold Miners ETF which tracks the GDM – AMEX Gold Miners Index. XGD is the iShares Canadian Gold Sector ETF which tracks the S&P/TSX Gold Index. Both ETFs allows investors and traders to gain diversified gold mining equity exposure. The main differences are: The XGD trades on the Canadian Toronto stock exchange and is priced with Canadian dollar while the GDX trades on the American stock exchange – AMEX and priced with US Dollar.

Long term (weekly chart) the XGD retraced about 61.8% of its recent up leg (wave 1) and bounced of the 2003 high. The GDX retraced about 50% of its recent up leg (wave 1) and bounced from the 50 weekly moving average zone.


Short term both GDX and XGD had a A – B –C correction (wave 2) , resistance at the diagonal line – I expect a strong rally once the trend line is broken.

For free (needs short registration) Elliott wave tutorial see EWI.


XGD ETF weekly chart

GDX ETF weekly chart

XGD ETF daily chart

GDX ETF daily chart

Labels: , , , ,

Thursday, June 08, 2006

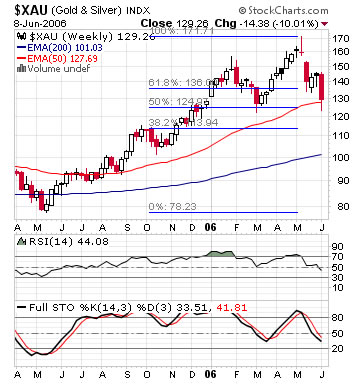
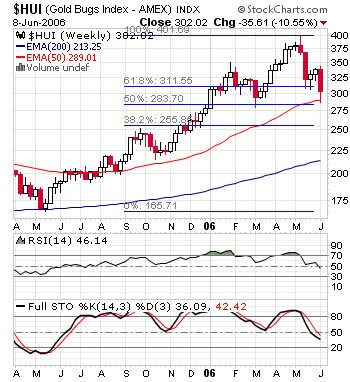
Gold Stocks Indices: XAU, HUI, GDM (GDX)

PHLX Gold & Silver Sector, XAU

Amex Gold Bugs Index, HUI

Amex Gold Miners Index , GDM - tracked by the GDX Market Vectors-Gold Miners ETF.

All Three main Indices looks similar, ~50% correction and bounced slightly - Fibonacci magic?

XAU weekly chart

HUI weekly chart

GDM (GDX) weekly chart

Labels: , , , ,

Saturday, May 27, 2006

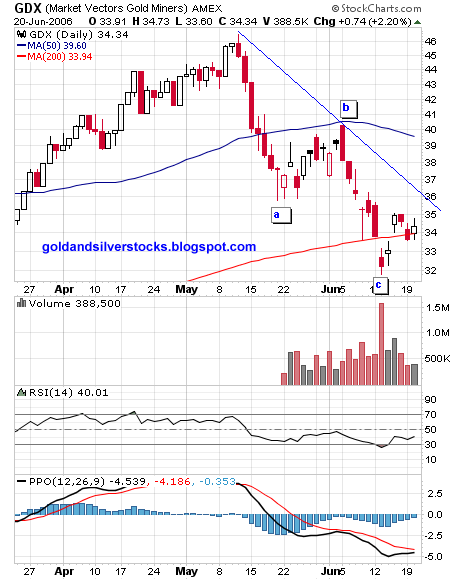
Market Vectors-Gold Miners ETF GDX GDM

The New Amex Gold Miners Index - GDM tracker is the Market Vectors-Gold Miners ETF GDX - by Van Eck Global.
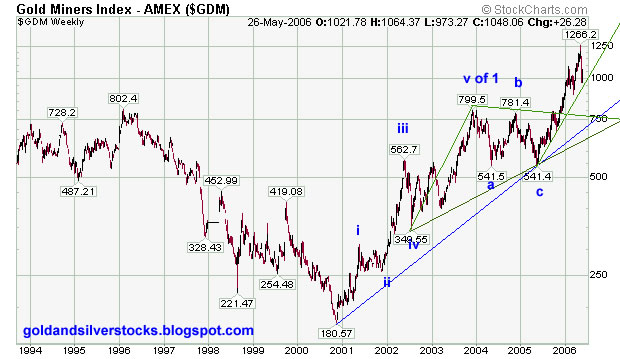
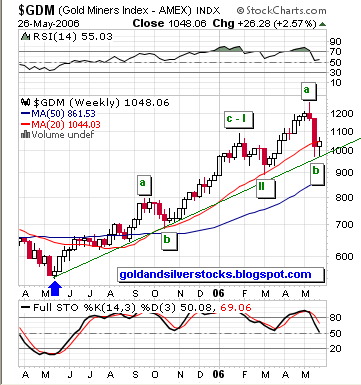
Here are two charts of the GDM Index annotated with Elliott Wave Count(click to enlarge).

Related :
commodity wave counts
gold spot wave count
Elliott Wave Tutorial
GDX by Jack Chan


Market Vectors-Gold Miners etf GDX GDM


Gold Miners Index GDM , GDX

Labels: , ,

Monday, May 22, 2006

AMEX Launches New Gold Miners ETF GDX - by Van Eck Global

Market Vectors-Gold Miners ETF is US First and Only ETF Offering Broad Exposure to Gold-Mining Companies.


NEW YORK--(BUSINESS WIRE)--May 22, 2006--The American Stock Exchange® (Amex®), together with Van Eck Global, today announced the launch of the Market Vectors-Gold Miners ETF (the "Fund"). Now available for trading on the Amex under the ticker symbol GDX, this new exchange-traded fund (ETF) is designed to track the performance of the Amex Gold Miners Index (Amex: GDM - News) and is the first and only exchange-traded fund in the U.S. that offers investors broad exposure to the gold-mining equity market.

The Amex Gold Miners Index currently has 44 constituents, exceeding the scope of any other gold-mining-oriented index. The Index seeks to provide a balanced, diversified approach by including a comprehensive range of small, mid-sized and large companies from around the globe. The Amex Gold Miners Index was created by Amex in 2004 and is back-tested to September 1993.

While there are currently two exchange-traded funds on the market providing direct exposure to gold bullion, the Market Vectors-Gold Miners ETF is the nation's first and only exchange-traded fund to provide exposure to gold-mining shares.

"The American Stock Exchange is delighted to partner with Van Eck Global to bring this exciting new ETF to the marketplace," said Cliff Weber, Senior Vice President of the Amex's ETF marketplace. "Van Eck Global is a respected leader in offering gold-mining investment products, and the Amex is extremely pleased to have been selected to list their first ETF, which is a welcome addition to the Amex family of innovative products."

The current bull market in gold is now in its fifth year. "That is an extraordinary milestone," said Joseph Foster, who has been involved in the management of various Van Eck gold funds since 1996. "We at Van Eck believe that the vulnerability of the U.S. dollar, the twin deficits and other financial imbalances could lead to economic stress that supports a continued positive view on gold-related investments. The Market Vectors-Gold Miners ETF is designed for investors looking for the traditional diversification benefits of gold-related investments as well as the liquidity that intra-day trading access provides," Mr. Foster said.

Investors are becoming increasingly aware of the diversification benefits associated with gold and other commodity-related investments. "We believe that financial advisors and their clients will benefit from innovative ways to gain exposure to these markets," said Jan van Eck, Executive Vice President of Van Eck Global. "This new ETF underscores our long-standing commitment to commodity-related asset classes by providing a more diverse range of gold-related investment tools to the financial community."

Who Should Invest in the Market Vectors-Gold Miners ETF?

This ETF is designed for investors (institutions, hedge-fund and mutual-fund portfolio managers, as well as individual investors) seeking broad exposure to gold-mining shares. Stocks of gold-mining companies can be an effective way to leverage changes in the price of bullion. The Market Vectors-Gold Miners ETF is suitable for long-term investments; the Fund may also be sold short, thereby acting as a speculative hedging investment.

Van Eck Global is a pioneer and industry leader in commodity-related investment vehicles. Van Eck has been investing globally for more than fifty years and has been managing gold-related investments since 1968, when it introduced the nation's first gold-mining-oriented mutual fund. In addition to the Market Vectors-Gold Miners ETF, the Firm offers gold- and commodity-oriented mutual funds, variable insurance trust funds, institutional accounts and hedge funds.

The specialist for the Market Vectors-Gold Miners ETF is Goldman Sachs Execution & Clearing, L.P.

source


See also : Van Eck Seeks SEC Approval for Gold Shares ETF

Gold Market News and charts


GDM , GDX Market Vectors-Gold Miners ETFchart

Labels: , ,

Sunday, May 07, 2006

Van Eck Seeks SEC Approval for Gold Shares ETF

In the wake of the resounding success of gold bullion-backed ETFs, New York-based Van Eck Associates has filed a registration statement with the SEC for approval of the first U.S. ETF that would focus on gold and silver mining company stocks.

According to documents recently filed with the SEC, the objective of the Market Vectors ETF Trust is "to replicate as closely as possible, before fees and expenses, the price and yield performance of the AMEX Gold Miners Index."

The Gold Miners Index (GDM) only invests in companies with a capitalization greater than $100 million that have traded on an average daily volume of at least 50,000 shares over the past six months. The index includes 43 gold and silver companies. Among the companies listed on the GDM are major gold producers, such as AngloGold Ashanti Barrick, Freeport McMoRan, Gold Fields, Goldcorp, and Newmont. Among the junior gold miners, explorationists, and royalty companies on the GDM are Eldorado Gold, Meridian Gold, Randgold Resources, Crystallex,, Northern Orion, and Royal Gold. Silver miners and explorationists on the index include Apex Silver, Coeur d'Alene Mines, Hecla, Pan American Silver, and Silver Standard Resources.

Van Eck Associates has already experienced success in its Global Hard Assets Fund (GHAAX), which invested in energy and metals, and its International Investors Gold Fund (INIVX). Both funds are garnering high ratings from the Morningstar investment research firm.

Van Eck proposes to charge a total net annual fund operating expense of 0.55% for the Market Vectors ETF Trust. One of the major differences between investing in shares and holding gold bullion is taxes. Precious metals are classified as a "collectible," and are subject to higher taxes. However, mining shares tend to be more volatile than physical metal because of the higher risks associated with actually mining the ore. source


Amex Gold Miners Index (GDM) chart

Amex Gold Miners Index (GDM) chart

Labels: ,