Friday, July 06, 2007
Saturday, June 23, 2007
HUI Update
Yet another Breakout attempt, the HUI managed to climb above short term diagonal trend line resistance. A retest of the broken trend lined and 200 DMA followed.
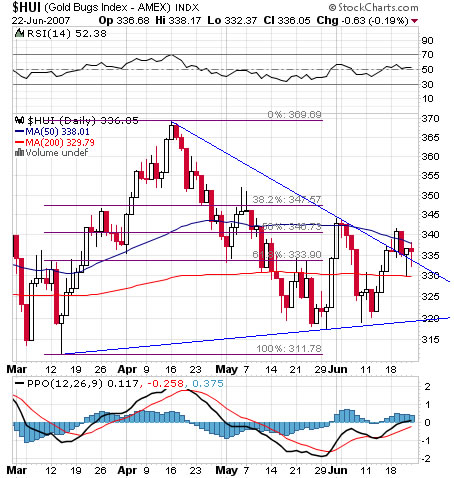
Support around recent cycle low 317.70 further support at previous cycle low 311.78.
Technical indicators: RSI slightly above 50, PPO had a bullish crossover and seems to be trending higher.

It is likely that if the HUI can trade above 344.07 it will aim to 369.69 and further.
The bigger picture: the HUI, Gold, Silver, Etc. - All consolidated for a long period of time so giving a chance to the small technical improvement might be a wise thing to do.
Some index components enjoy a relatively high level of short interest ratio.
ShortSqueeze.com data : Eldorado Gold (EGO), Randgold Resources(GOLD) ,Coeur dAlene Mines(CDE), Hecla Mining Company (HL) ,Golden Star Resources(GSS), IAMGOLD(IAG).
Check them out (fundamentals ,TA. Etc) – they might be a good play.
Monday, April 23, 2007
Few notes on XAU & HUI
Currently Gold and Silver stocks indices seem to consolidate the March – April gains. Overall the picture is positive as higher high was printed for XAU & HUI.
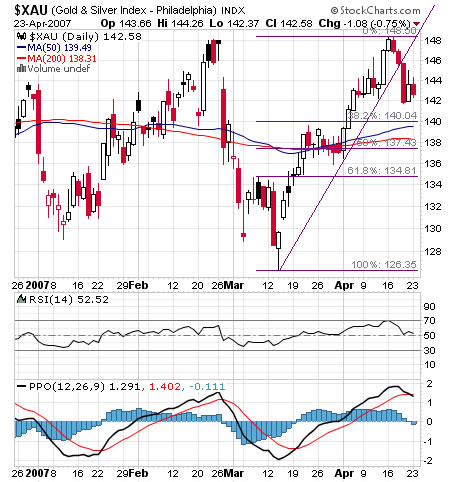

XAU continue to lead in terms of options volume and open positions.
HUI leads in terms of price (less hedged). RSI is higher.

Volume is important and the XAU will dictate the Elliott wave count. XAU tends to print lower lows (wave c vs. wave a) while HUI is confused with truncated correction waves.


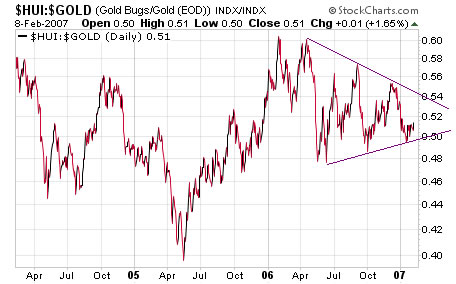
XAU / Gold & HUI / Gold Ratios – still underperforming, triangle formation – no breakout yet.


Patience is indeed required as S.M Himes posted.
It is possible that indices and gold both forming an Egg pattern. I will post more about the Egg pattern on the Gold Global Perspective section.
Tuesday, April 10, 2007
Wednesday, March 28, 2007
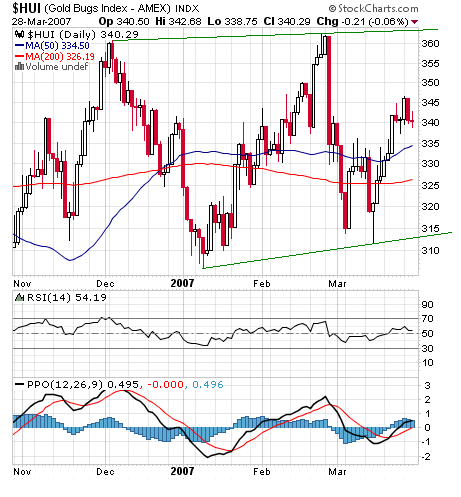
Quick HUI Update
Reasons for modest bullish bias:
1) Slightly higher high and higher lows
2) Consolidation around the 200 & 50 Daily moving averages.
3) PPO bullish crossover and RSI above 50.
See the latest gold chart
Labels: HUI
Sunday, February 25, 2007
Gold Indices Review
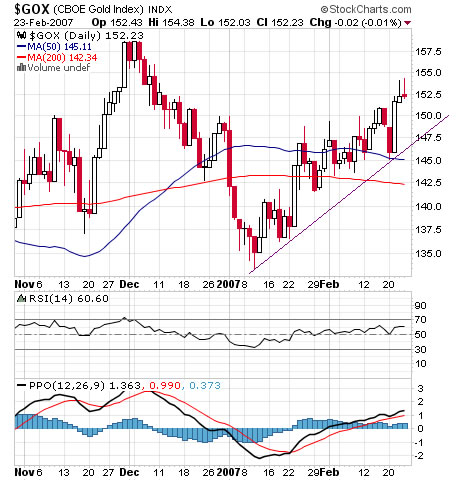
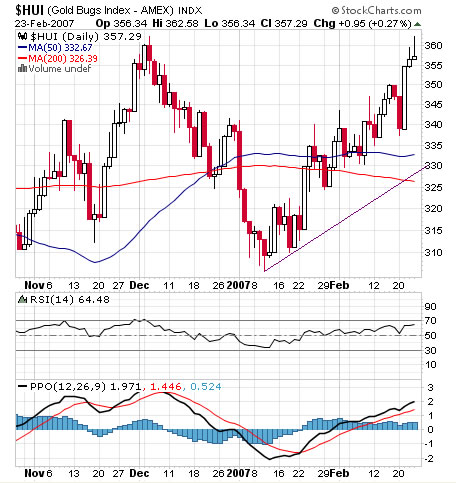
Despite of recent spike in the price of gold and silver, gold indices continue to under perform.
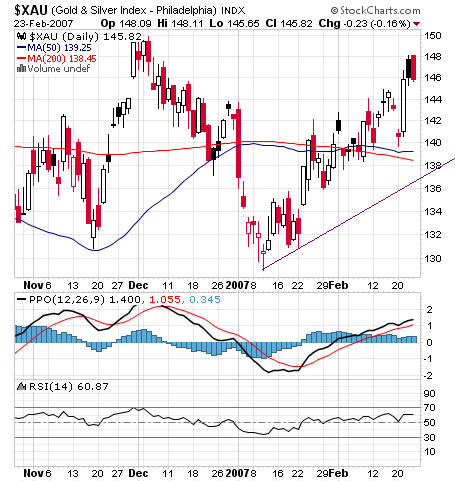
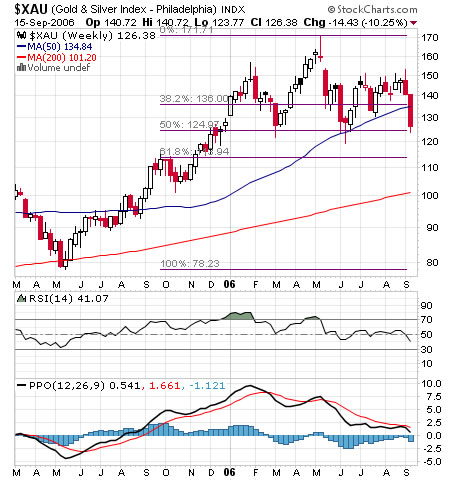
Of all four gold indices I'm tracking (XAU, HUI, GDX(GDM), GOX) the XAU is senior both in terms of option trading volume and chart history.
Short term trend line support around 137, recent short term cyclical low at 129.


the PHLX gold and silver index is calculated since early 1979 ( =100)

GDX(Market Vectors Gold Miner) is the only gold miners ETF trading at the US, tracks the GDM (AMEX Gold Miners Index). Last Friday the GDX managed to trade above its January top but closed under. Short term trend line support around 40.25, recent short term cyclical low at 36.19.

GOX (CBOE Gold Index) , Chicago is a major center for gold, silver and other futures trading. Short term trend line support around 148, recent short term cyclical low at 133.45.

HUI(AMEX Gold Bugs Index) is favored for the reason its components are relatively unhedged. Short term trend line support around 331, recent short term cyclical low at 306.

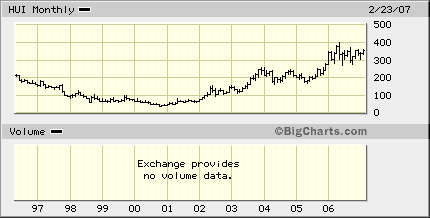
Note that the HUI is already up several hundreds percents since the bear market bottom.

Generally, currently I do not favor initiating any new gold/ silver / PM's positions. On the other hand - I think that a pullback might find support at short term uptrend lines with but holding above recent cyclical low is much more important for the long term bullish picture.
Friday, February 09, 2007
HUI and GDX charts update
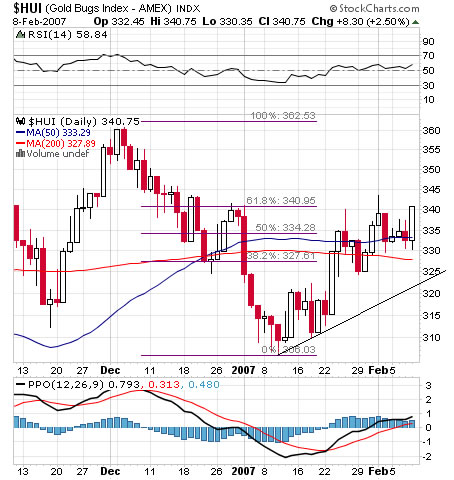
The two charts looks almost identical, the price is above the 50 MA, The 50 MA is above the 200 MA, and RSI trending up above 50, PPO lines are above zero.
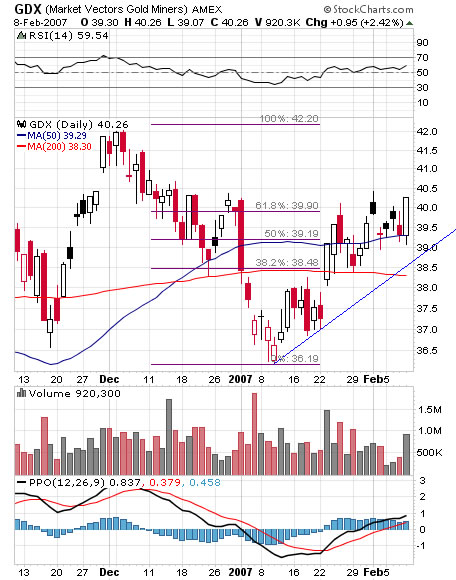
However, while gold recently climbed above its December top gold indices and silver did not. The HUI Gold ratio is trapped inside a contracting triangle formation. Overall the charts look bullish but the non confirmation implies caution.


Thursday, January 11, 2007
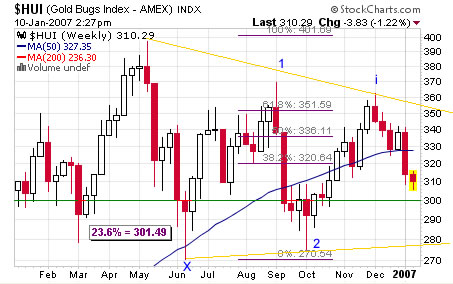
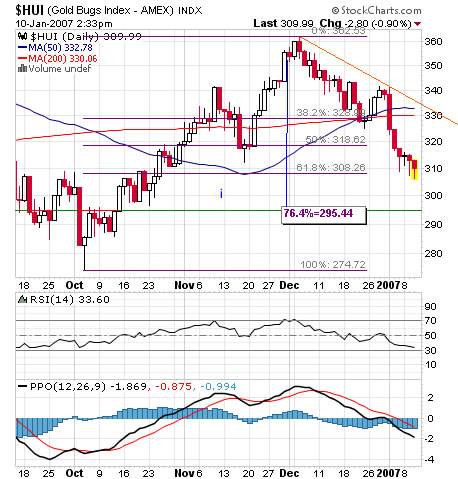
$HUI Fibonacci Charts
The $HUI like other mining indices is currently retracing the October to December 2006 advance (wave i of 3) Similar to this spot gold wave analysis It is more likely then not that the $HUI will not go below the October 2006 low (labeled 2). – This is my opinion. One should be both cautious and have patience. Interested about waves analysis? – see this tutorial (need short registration)
Labels: Elliott Wave, Fibonacci, HUI
Wednesday, December 06, 2006
HUI Breakout
The gold bugs index managed to close above diagonal resistance few days in a row.
MACD bullish crossover and RSI is trending up. Expect higher highs.

Labels: HUI
Tuesday, November 21, 2006
Gold Bug Index (HUI) Charts
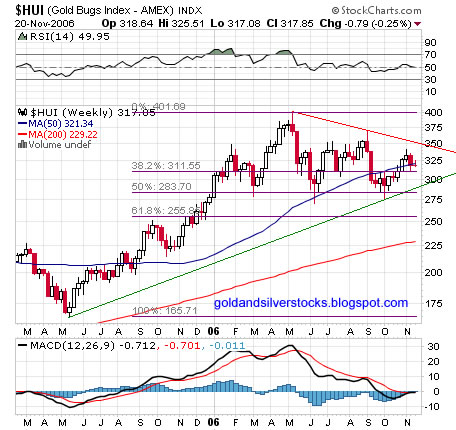
The HUI is currently priced between its 50 and 200 daily moving averages.
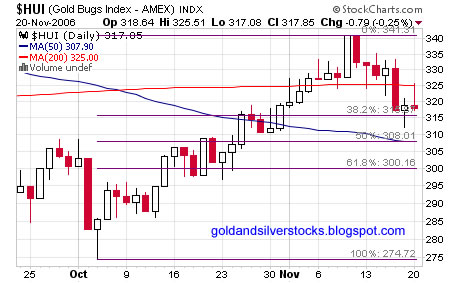
Daily and weekly chart below are self explaining. Close above 350 will indicate that the HUI is headed to new highs; a break below 290 will signal that more consolidation is needed. Technical indicators on the weekly chart are natural.

Wednesday, October 04, 2006
HUI / GOLD Ratio.
The HUI chart might look kind of ugly after the latest dump but technically nothing of great significance had happened. The HUI like most other gold and silver stocks indices did not go below the June lows.
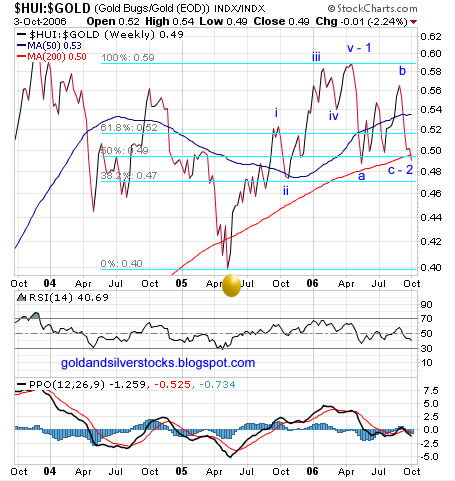
Closely examining the Hui/gold ratio, notice the wave count and the implication of the wave count if true – a strong rally which should follow once the washout is over and the ABC (wave 2) correction is over. So, yes believe it or not I'm thinking a strong and sustained gold rally is just around the corner. There are many good fundamental reasons for that and the technicals are slowly creating the perfect opportunity for long trades on many time frames.
Going forward gold / silver and PM's Investors and traders should pay attention to the following market information:
1) The spot and future price of gold and silver.
2) Mining indices : HUI , XAU , GDX, GOX.
3) The price of other precious metals (palladium, platinum. etc.)
4) The price of industrial metals.
5) The price of oil and the energy complex.
6) Interest rates and currencies.
7) General commodities markets

Labels: Elliott Wave, Gold, HUI
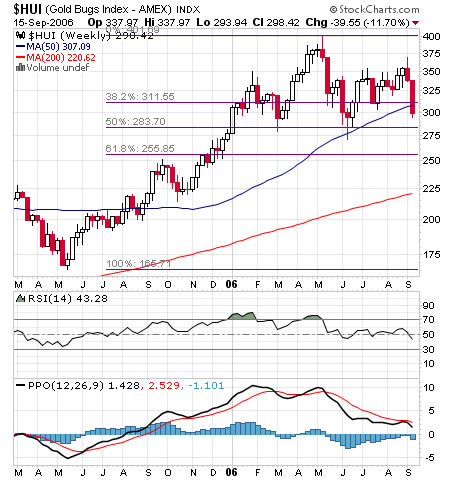
Saturday, September 16, 2006
Wednesday, August 16, 2006
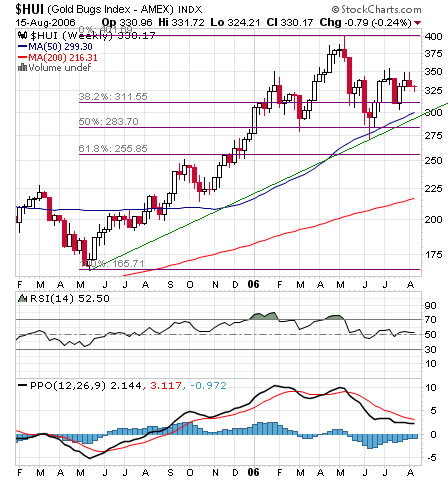
HUI – Update
Not much change since the last HUI update. For gold exposure go for GLD, for gold stocks GDX / XGD. If you trade individual miners stocks - be sure to know what you are doing since individual companies are much riskier then gold or silver. I'm currently not in the business of promoting stocks and I do not recommend any of the stocks mentioned.
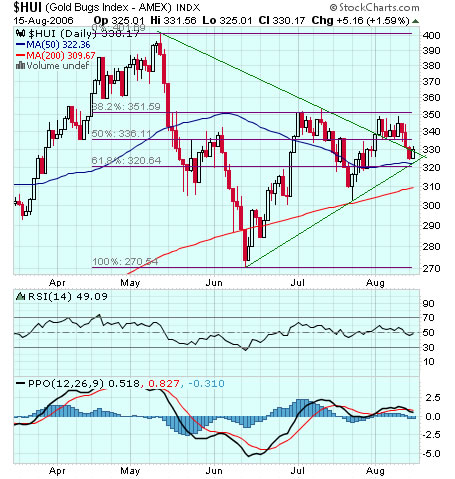
The daily chart is looking ok, RSI a bit below 50, PPO natural, triangle pattern. Support at 50 DMA and Fibonacci lines below current price. Resistance at Fibonacci lines above the current price.

The weekly chart is looking good. RSI above 50, PPO natural.
Saturday, July 29, 2006
HUI – Gold Bugs Index Technical Update
The HUI is a good proxy for the gold miners. Usually the HUI is outperforming the rest of the gold miners Indices ( XAU, GDM , GOX). Miners which are components of this index tend to have little gold hedge or none, thus providing investors with the full opportunity to enjoy this roaring global gold bull market.
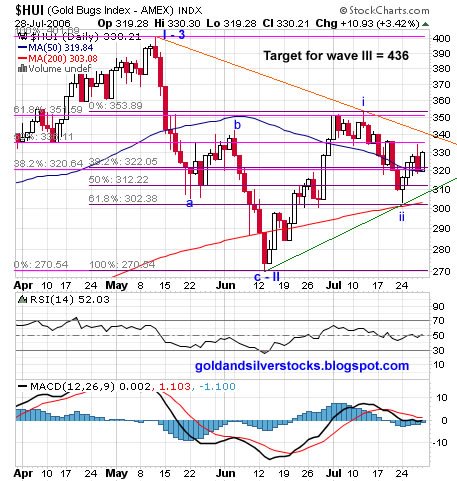
Technically, as noted at my last update, the HUI completed ABC correction wave (wave II – 3), followed by minor up wave ( i- III) and then a minor wave down ( ii – III). Currently The HUI is at the beginning of wave (iii – III) which is part of a larger degree third wave up – This is a triple three wave up and as such it encapsulate a potential for extremely large gains on the upside. This is the time you want to be fully long all good quality things gold and don’t be quick to take profit.
Below is HUI daily chart annotated with 2 sets of Fibonacci retracement lines, pink set from top ( I – 3) to bottom (c- II) and purple set from bottom ( c- II) to minor top (i – III) the HUI is just above the 38.2% on both sets and the 50 DMA – this should provide good support. RSI above 50 , MACD flat above zero.
I repeat, this is the time to be fully long on gold and all of your favorite gold stocks as the potential for massive gains is extremely high in my opinion.

Labels: Elliott Wave, Fibonacci, HUI
Wednesday, July 19, 2006
HUI, GDX Technical Update
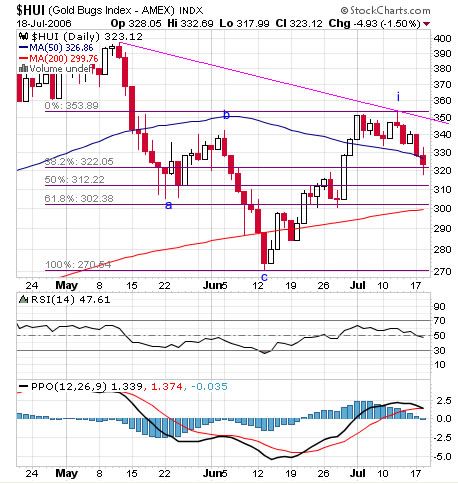
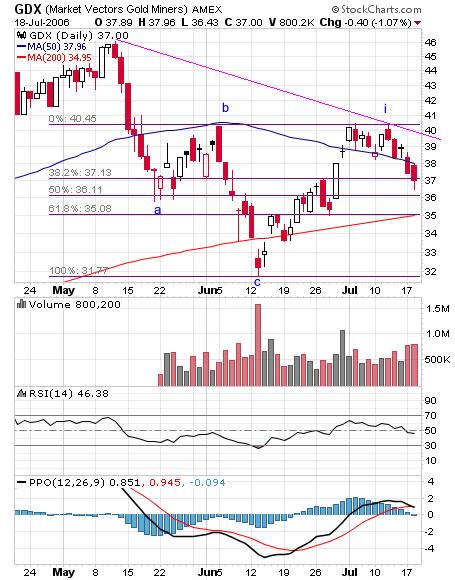
Same analysis for both charts, following the completion of A-B-C correction (wave 2) both the HUI and the Goldminer ETF (GDX) have just completed minor wave up (i) , minor wave (ii) is underway and should be terminated at one of the Fibonacci lines below current price. RSI trending down below 50 , PPO natural. Support at Fib lines and 200 DMA. Once the minor correction wave (ii) is over, expect a minor yet extended wave (iii) which will probably take both GDX and HUI higher to retest the all time highs. Remember - all is subject to the price of gold (POG) - see my latest gold price analysis.
Labels: Elliott Wave, Fibonacci, GDM, GDX, HUI
Thursday, July 06, 2006
HUI (AMEX Gold Bug Index) – Update
The HUI bottomed at 270.54 after a typical ABC correction then rallied to the 61.8% FIB, currently still above the 50 daily moving average, RSI trending up above 50, PPO bullish crossover, PPO histogram positive, ADX bullish crossover.
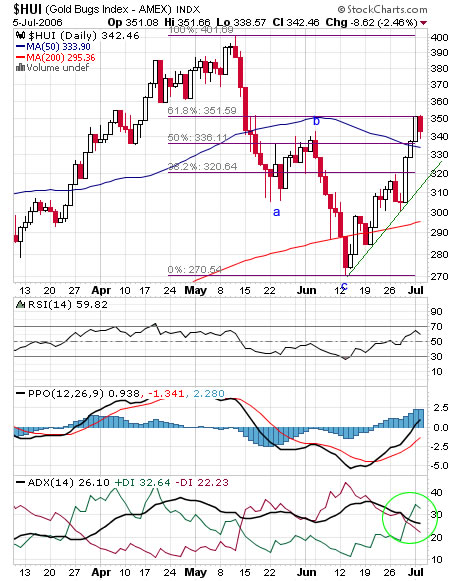
Given the quick recovery and some resistance at the 61.8% FIB we might see a bit of a consolidation at current level with good support at green uptrend line, 50 DMA, 200 DMA and the 38.2% FIB line. The HUI will be affected from both the price of gold and the general stock market. Use any weakness to accumulate your favorites gold and silver stocks.

Labels: Elliott Wave, Fibonacci, HUI
Thursday, June 22, 2006
HUI – Buy Signals
HUI – the AMEX Gold Bugs Index is a basket of relatively unhedged gold miners. Gold Indices like the HUI tend to lead the price of gold. Technically I observe three buy signals on the short term daily chart:
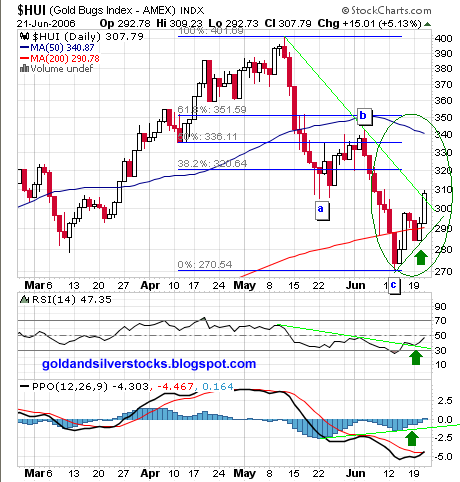
1) Diagonal downtrend line (previous resistance) is broken to the upside.
2) RSI downtrend line is broken.
3) PPO Histogram showing positive divergence.
So, unless the A-B-C correction develops into A to E correction (unlikely) it is reasonable to assume that the HUI is headed higher. The May top (401.69) will get tested and Higher high is certainly a possibility.
The technical situation of other gold indices (XAU, GOX & GDM) is similar. Investors and traders can get exposure to gold mining equity with the GDX ETF.
Browse Gold and Silver Mining Stocks blog Archive. See gold and silver charts and commentary. Visit commodities blog.

Labels: Elliott Wave, Fibonacci, HUI
Thursday, June 08, 2006
Tuesday, May 16, 2006
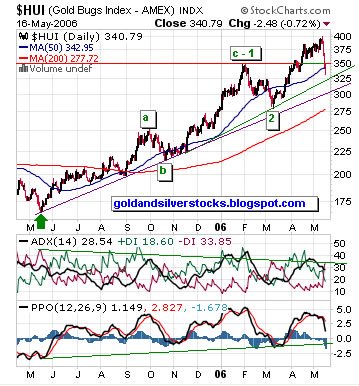
HUI - Amex Gold Bugs Index Elliott Wave Count
Here are some HUI - Amex Gold Bugs Index charts. The charts are annotated with Elliot wave's counts, Fibonacci support lines, moving averages, trend lines and other technical indicators. To put it simply: It is my opinion that the HUI is close or already had bottomed. Like Gold I think that the HUI will go much higher, however I think that at some point and under some circumstances the price of gold and / or the price of silver will outperform the HUI index.
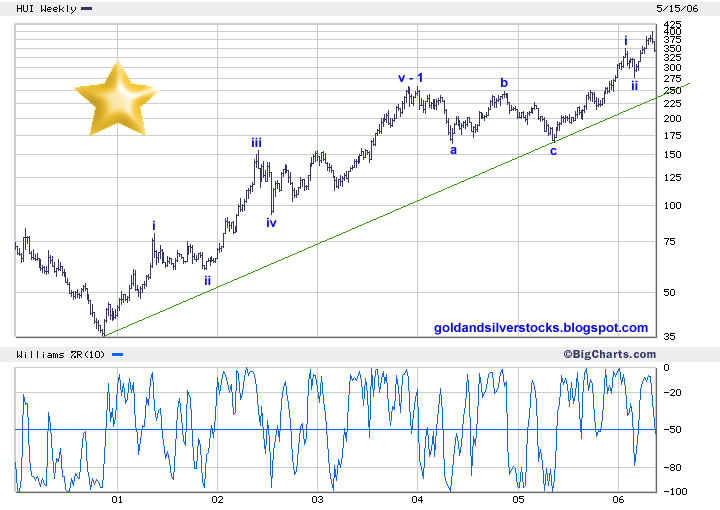
HUI logarithmic weekly chart, bear market bottom to date - click on the chart below to enlarge:

HUI linear weekly chart, bear market bottom to date - click on the chart below to enlarge:

HUI daily chart - one year

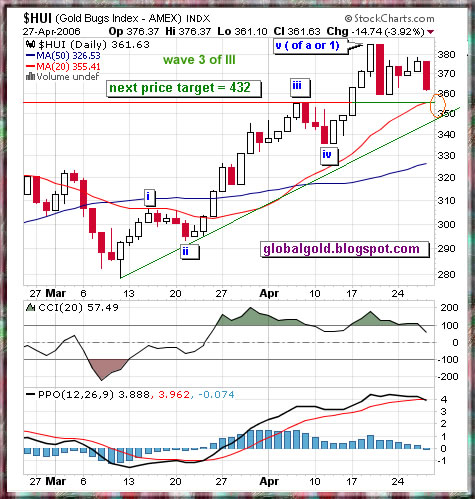
HUI daily chart - three month

- For Elliott Wave analysis I highly recommend the book: Elliott wave principle.
- See previous HUI Posts
- IF you need a Free Real time quotes and charts for Gold, Commodities, Forex, Indices & Stocks (registration is required) try ADVFN
- For viewing online charts, images and pictures I highly recommend the FireFox browser.
Labels: Elliott Wave, HUI
Thursday, April 27, 2006
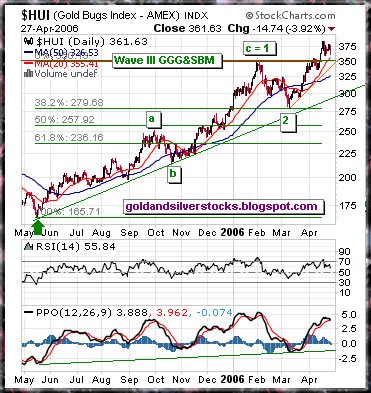
HUI – Amex Gold Bug Index E – Waves
The HUI is up around 120% since the second leg (Elliott Wave III) of the Great Global Gold & Silver Bull Market started at May 2005. However, there is still a lot of upside potential. Short term it seems like a minor ( 2 or b) correction is taking place.
Related:
HUI components, Gold & Silver Spot Charts, Platinum Long Term Charts , More HUI posts , Ralph Nelson Elliott biography.


Labels: Elliott Wave, HUI