Gold Indices Review
Despite of recent spike in the price of gold and silver, gold indices continue to under perform.
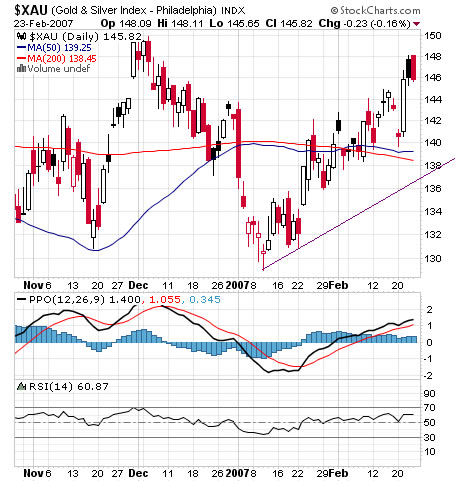
Of all four gold indices I'm tracking (XAU, HUI, GDX(GDM), GOX) the XAU is senior both in terms of option trading volume and chart history.
Short term trend line support around 137, recent short term cyclical low at 129.


the PHLX gold and silver index is calculated since early 1979 ( =100)

GDX(Market Vectors Gold Miner) is the only gold miners ETF trading at the US, tracks the GDM (AMEX Gold Miners Index). Last Friday the GDX managed to trade above its January top but closed under. Short term trend line support around 40.25, recent short term cyclical low at 36.19.

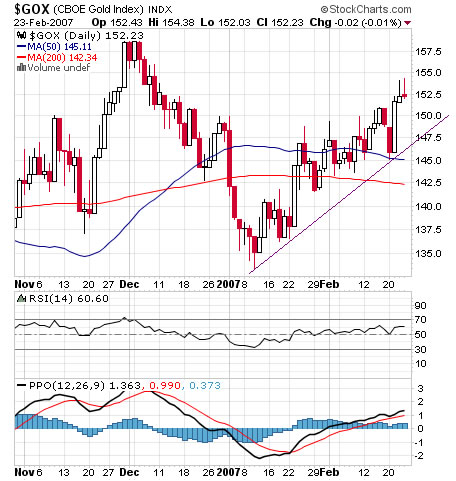
GOX (CBOE Gold Index) , Chicago is a major center for gold, silver and other futures trading. Short term trend line support around 148, recent short term cyclical low at 133.45.

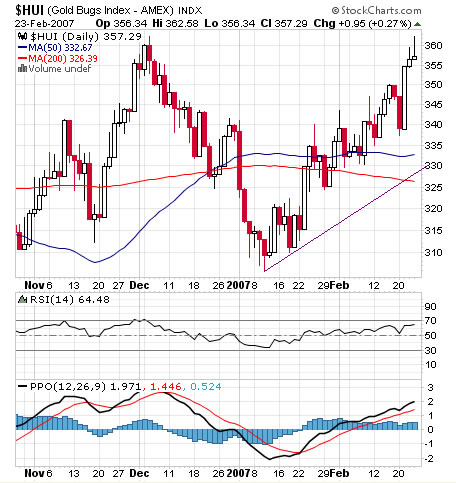
HUI(AMEX Gold Bugs Index) is favored for the reason its components are relatively unhedged. Short term trend line support around 331, recent short term cyclical low at 306.

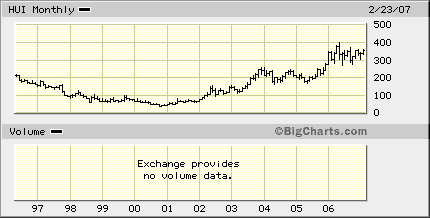
Note that the HUI is already up several hundreds percents since the bear market bottom.

Generally, currently I do not favor initiating any new gold/ silver / PM's positions. On the other hand - I think that a pullback might find support at short term uptrend lines with but holding above recent cyclical low is much more important for the long term bullish picture.


0 Comments:
Post a Comment
<< Home