


GG, Gold Corp Inc. at 25% discount !
Put GG on your radar screen if it isn't already there. GG is usually leading gold mining stock with shallow pullbacks and quick recoveries.
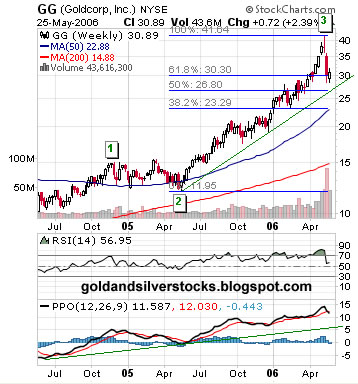
Technically the weekly chart looks pretty good, the price is just above the 61.8% Fibonacci support level , the local low was higher then the 50% Fibonacci line. Trend line support is also present not far below the price. Defiantly a stock to follow if you are gold stocks trader / investor. – Off course all is up to the price of gold which I think just organizing itself after an important [e] bottom. Interested about commodity charts analysis? – see commodity charts blog.
*$$$$$$$$$$$$$$$$$$$$$$$$$$$$$$$$$$$$$$$$$$$$$$$$$$$$*
Monthly long term chart - click to enlarge (FireFox recommanded)
Labels: Elliott Wave, GG
posted by troy @ 5/25/2006
![]()
![]()
0 Comments:
Post a Comment
<< Home