Thursday, January 11, 2007

$HUI Fibonacci Charts

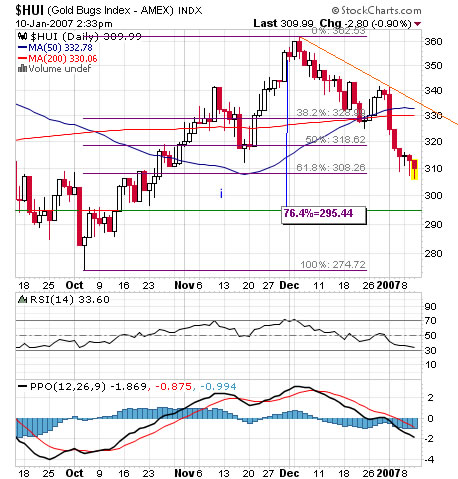
The $HUI like other mining indices is currently retracing the October to December 2006 advance (wave i of 3) Similar to this spot gold wave analysis It is more likely then not that the $HUI will not go below the October 2006 low (labeled 2). – This is my opinion. One should be both cautious and have patience. Interested about waves analysis? – see this tutorial (need short registration)
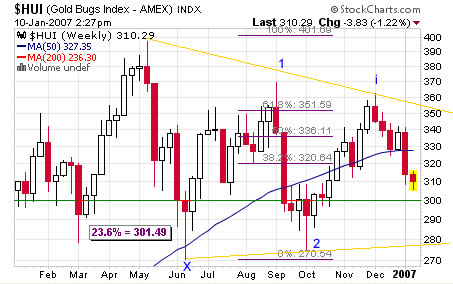
$Hui weekly chart

$Hui daily chart

Labels: , ,

Tuesday, October 31, 2006

Silver Standard Resources (SSRI)

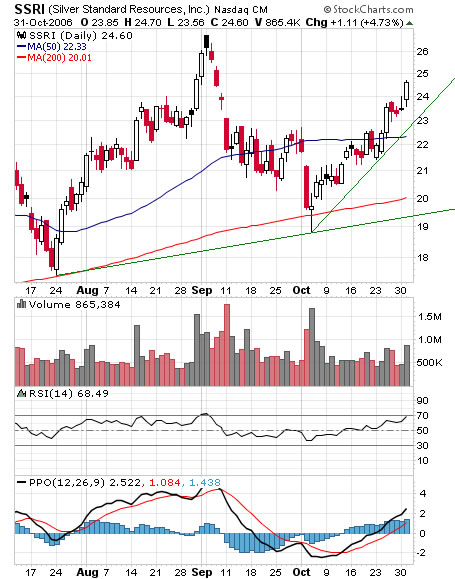
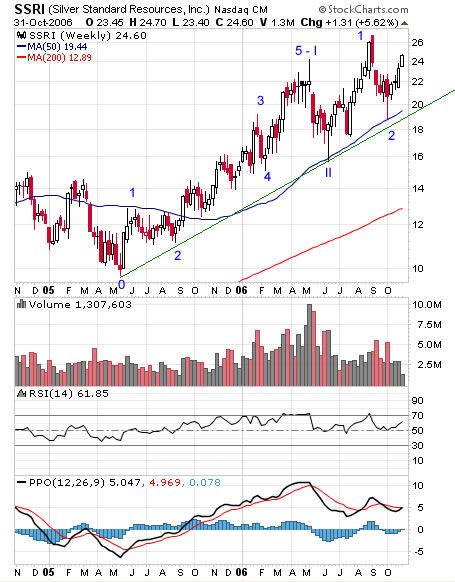
SSRI is definitely a silver stock for your watch list. From a technical point of view SSRI performance was no less then impressive given the long consolidation of silver.

Few days ago I posted about Kinross Gold; Technically SSRI is in the same situation like KGC which makes them both worth watching.

Silver Standard Resources daily chart

ssri weekly chart

Labels: ,

Sunday, October 22, 2006

Kinross Gold

Interesting that for some reason Kinross Gold is quite strong compared to gold, silver, mining indices and most other gold and silver miners.

Note that KGC made higher highs and higher lows while mining indices made lower highs and higher lows.


kgc weekly chart

kgc long term chart

Labels: ,

Monday, October 09, 2006

Newmont mining

NEM is around the 200 weekly moving average and investors / traders might want to pay attention to this stock.

Newmont mining weekly chart

Labels: , ,

Wednesday, October 04, 2006

HUI / GOLD Ratio.

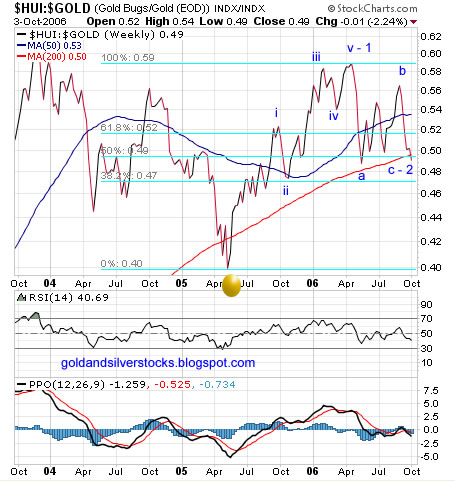
The HUI chart might look kind of ugly after the latest dump but technically nothing of great significance had happened. The HUI like most other gold and silver stocks indices did not go below the June lows.

Closely examining the Hui/gold ratio, notice the wave count and the implication of the wave count if true – a strong rally which should follow once the washout is over and the ABC (wave 2) correction is over. So, yes believe it or not I'm thinking a strong and sustained gold rally is just around the corner. There are many good fundamental reasons for that and the technicals are slowly creating the perfect opportunity for long trades on many time frames.


Going forward gold / silver and PM's Investors and traders should pay attention to the following market information:

1) The spot and future price of gold and silver.

2) Mining indices : HUI , XAU , GDX, GOX.

3) The price of other precious metals (palladium, platinum. etc.)

4) The price of industrial metals.

5) The price of oil and the energy complex.

6) Interest rates and currencies.

7) General commodities markets


hui/gold ratio chart

Labels: , ,

Sunday, September 24, 2006

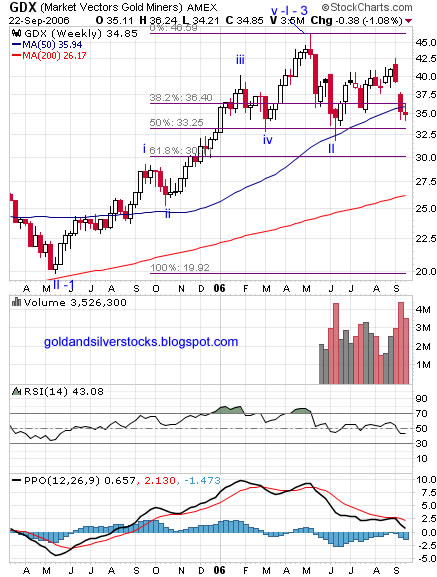
GDX – goldminers ETF Charts

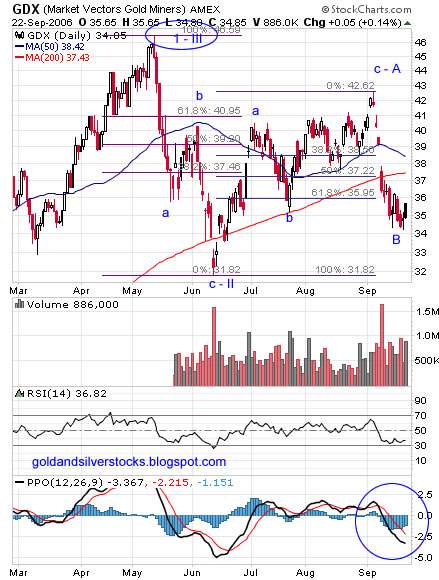
GDX is currently the most diversified golminers trading instrument.

Technically the GDX is trapped between the May high (46.59$) and the June low (31.82$). I annotated the charts with Fibonacci support/ resistance levels and Elliott wave count. If the wave count is correct then the GDX will soon head back up and the last low (labeled B) should probably hold.

The PPO indicator on the daily chart is sowing signs of turning back up. On the Weekly chart the PPO is still above zero.

GDX – goldminers ETF daily Chart


GDX – goldminers ETF weekly Chart

Labels: , ,

Tuesday, August 22, 2006

VGZ, MNG - Charts

Technically, I like both VGZ and MNG .

Miramar Mining Corporation (AMEX: MNG),(TSE: MAE)

RSI trending up above 50, PPO trending up , PPO histogram positive. Trend line support at 3.30$ and rising, 50 DMA = pivot.. Triangle formation, resistance at 4.3$ expect a strong rally to 5.70$. and above if the stock can close above 4.30$ on decent volume.


Miramar Mining Corporation, mng chart


Vista Gold Corp. - VGZ (AMEX / TSX)

RSI trending up above 50, PPO trending up , PPO histogram natural. Trend line support at 9.50$ and rising, 50 DMA trending up, made a new long term high few days ago. Rising wedge formation – seems to break to the upside. – can quickly go to 15$ if the price of gold permits.


Vista Gold Corp., VGZ chart

Labels: , ,

Thursday, August 03, 2006

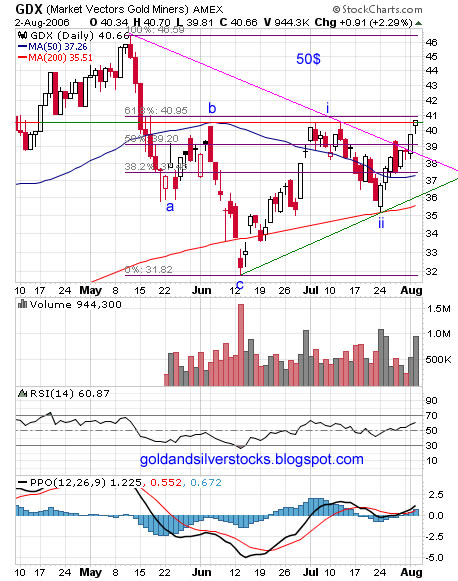
GDX – Gold Miners ETF

The GDX along the XGD is excellent trading / investment tool which enable both positive and negative diversified exposure to the gold mining industry.

Technically, breakout above the diagonal pink resistance line (currently support), slight resistance at the 61.8% Fibonacci line. Inverted head and shoulders pattern with price target of 50$. For practical objectives the same analysis is good for other gold miners indices.

Technical indicators: RSI trending up above 50, PPO bullish crossover, positive PPO histogram.

Support : Fibonacci lines below the current price , pink and green trend lines.

Resistance: 61.8% Fibonacci line, 43$ and the May high.

GDX – Gold Miners ETF chart

Labels: , , ,

Saturday, July 29, 2006

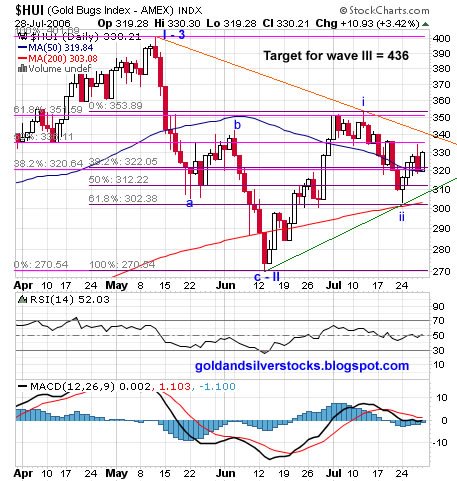
HUI – Gold Bugs Index Technical Update

The HUI is a good proxy for the gold miners. Usually the HUI is outperforming the rest of the gold miners Indices ( XAU, GDM , GOX). Miners which are components of this index tend to have little gold hedge or none, thus providing investors with the full opportunity to enjoy this roaring global gold bull market.

Technically, as noted at my last update, the HUI completed ABC correction wave (wave II – 3), followed by minor up wave ( i- III) and then a minor wave down ( ii – III). Currently The HUI is at the beginning of wave (iii – III) which is part of a larger degree third wave up – This is a triple three wave up and as such it encapsulate a potential for extremely large gains on the upside. This is the time you want to be fully long all good quality things gold and don’t be quick to take profit.

Below is HUI daily chart annotated with 2 sets of Fibonacci retracement lines, pink set from top ( I – 3) to bottom (c- II) and purple set from bottom ( c- II) to minor top (i – III) the HUI is just above the 38.2% on both sets and the 50 DMA – this should provide good support. RSI above 50 , MACD flat above zero.
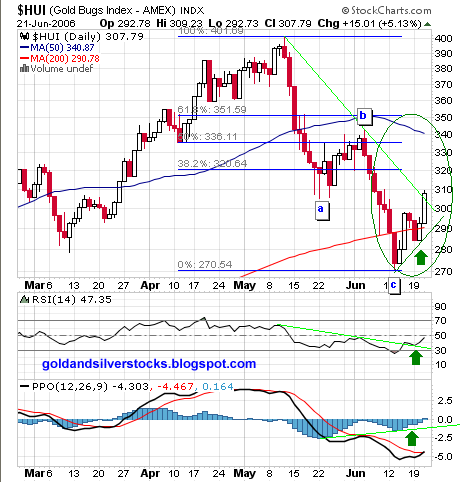
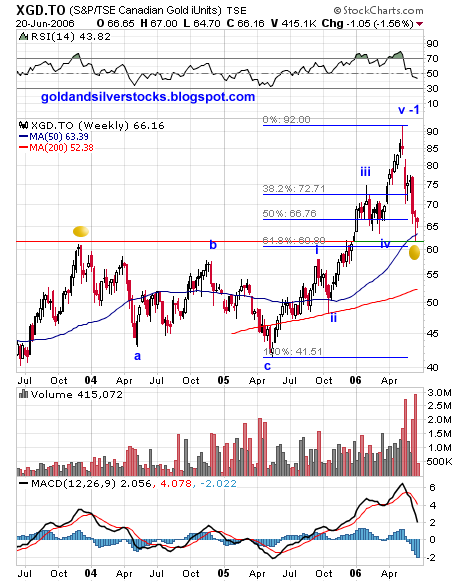
I repeat, this is the time to be fully long on gold and all of your favorite gold stocks as the potential for massive gains is extremely high in my opinion.

HUI – Gold Bugs Index chart

Labels: , ,

Wednesday, July 19, 2006

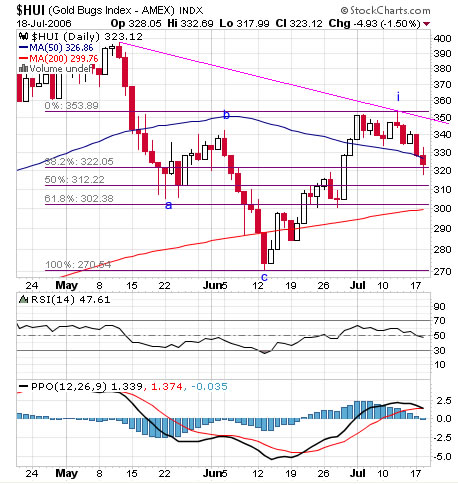
HUI, GDX Technical Update

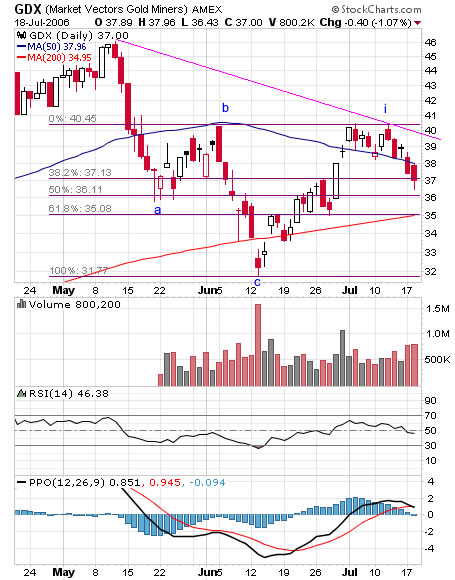
Same analysis for both charts, following the completion of A-B-C correction (wave 2) both the HUI and the Goldminer ETF (GDX) have just completed minor wave up (i) , minor wave (ii) is underway and should be terminated at one of the Fibonacci lines below current price. RSI trending down below 50 , PPO natural. Support at Fib lines and 200 DMA. Once the minor correction wave (ii) is over, expect a minor yet extended wave (iii) which will probably take both GDX and HUI higher to retest the all time highs. Remember - all is subject to the price of gold (POG) - see my latest gold price analysis.

HUI - gold bugs index chart


GDX - golminer etf chart

Labels: , , , ,

Sunday, July 16, 2006

AngloGold Ashanti (NYSE:AU)

A.G asked for a review of AngloGold Ashanti (NYSE:AU)

Anglogold is a giant mining company with worldwide operations. The stock is listed on several exchanges including New York, Johannesburg, Ghanaian, London and Australian stock exchanges, as well as the Paris and Brussels bourses.

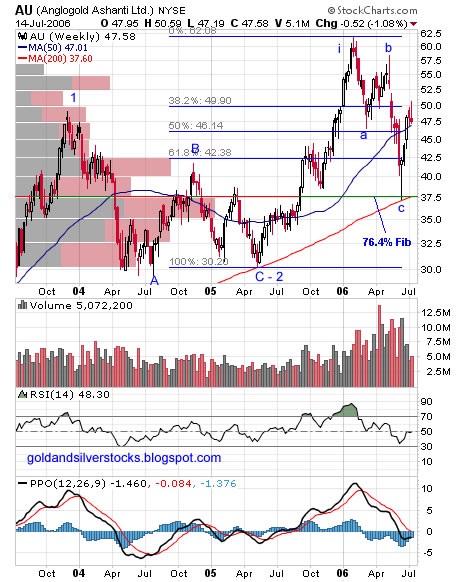
Weekly Chart

Top labeled (1) at Q4 2003 followed by a year and a half A-B-C correction (wave 2 down) and a touch at the 200 weekly moving average (WMA). Anglo is currently in wave (3) up. The stock topped well before the gold indices, lost about 76.4% of the (i – 3) minor up wave progress and bounced from the 200 WMA.

Indicators – RSI stagnant just below 50, PPO still bearish below zero.

Support –Fibonacci lines below the current price.

Resistance – at Fibonacci lines above the current price and the Q1-2006 top.


AngloGold Weekly Chart


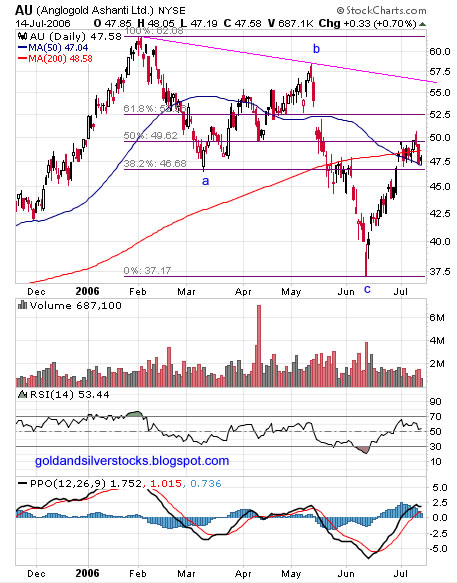
Daily chart

Rallied strongly lately from extreme oversold condition, 50 / 200 bearish DMA crossover.

Indicators – RSI trending down but still above 50, PPO above zero but seems to turn back down.

Support –Fibonacci lines below the current price.

Resistance – at Fibonacci lines above the current price and the and the pink downtrend line.


AngloGold Daily Chart


Labels: , ,

Thursday, July 06, 2006

HUI (AMEX Gold Bug Index) – Update

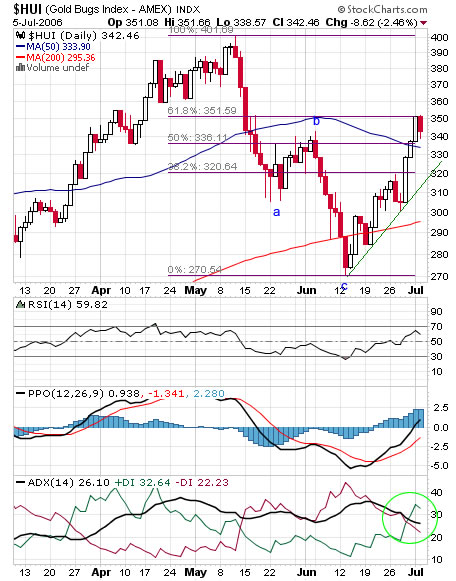
The HUI bottomed at 270.54 after a typical ABC correction then rallied to the 61.8% FIB, currently still above the 50 daily moving average, RSI trending up above 50, PPO bullish crossover, PPO histogram positive, ADX bullish crossover.
Given the quick recovery and some resistance at the 61.8% FIB we might see a bit of a consolidation at current level with good support at green uptrend line, 50 DMA, 200 DMA and the 38.2% FIB line. The HUI will be affected from both the price of gold and the general stock market. Use any weakness to accumulate your favorites gold and silver stocks.


HUI - AMEX Gold Bug Index Chart

Labels: , ,

Wednesday, July 05, 2006

Vista Gold Corp.- VGZ (AMEX / TSX)

bubble_watcher mentioned Vista Gold few days ago:

Vista Gold Corp.- VGZ (AMEX / TSX)
- based in Littleton, Colorado, evaluates and acquires gold projects with defined gold resources. Additional exploration and technical studies are undertaken to maximize the value of the projects for eventual development. The Corporation's holdings include the Maverick Springs, Mountain View, Hasbrouck, Three Hills, Wildcat projects, the F.W. Lewis, Inc. properties and the Hycroft mine, all in Nevada, the Long Valley project in California, the Yellow Pine project in Idaho, the Paredones Amarillos and Guadalupe de Los Reyes projects in Mexico, the Amayapampa project in Bolivia, the Awak Mas project in Indonesia and the Mt. Todd project in Australia.

http://www.vistagold.com

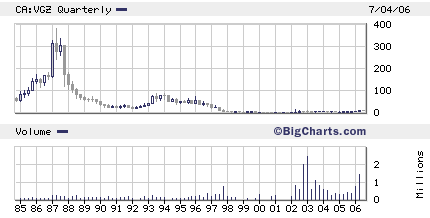
From the long term quarterly chart we can learn that Vista Gold was once 300$ stock (discounting 20:1 reverse split).

 Vista Gold long term chart


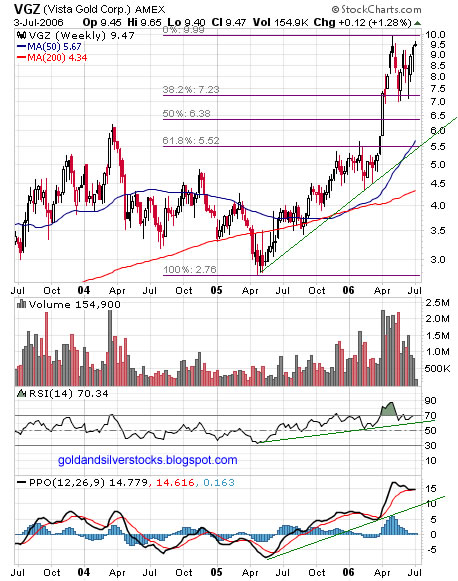
The 3 years weekly chart shows an Impressive rally (2.76$ - 9.99$) then a pullback to the 38.2% Fib line. RSI trending up , PPO trending up and PPO histogram still positive. The pullback did not damaged the bullish indicators.

Vista Gold weekly chart


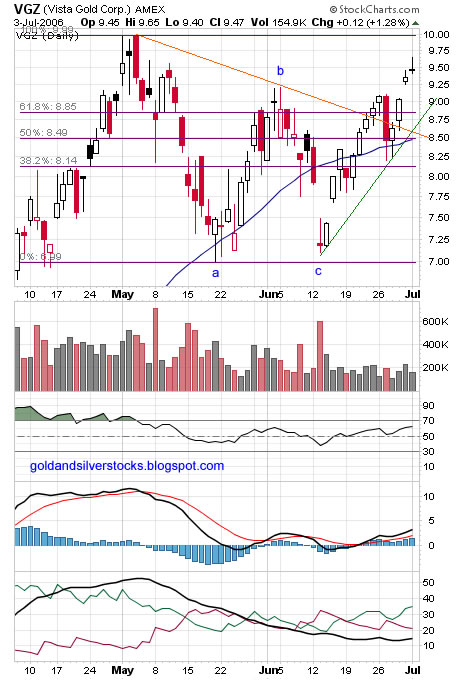
Short term daily chart – A-B-C correction (9.99$ - 6.99$), (C>A), break up above the 50 DMA and the orange downtrend resistance. Currently trading above all relevant fib lines. RSI looking good and trending up, PPO trending up above zero, PPO histogram positive, ADX bullish. Not much resistance other then the 9.99$ high

VGZ daily chart

Labels: , ,

Friday, June 30, 2006

NEM, FCX, CDE - Chart Reviews

Newmont Mining Corporation , NYSE : NEM

NEM - Typical A-B-C correction wave (59.59$ - 47.34$), went below the 200 DMA. Yesterday managed to break above the pink downtrend line, close above the 200 DMA and the 61,8% Fibonacci line. RSI trending up above 50, PPO positive crossover, PPO histogram positive, ADX bullish crossover. Nice candle on relatively high volume. Support at the 200 DMA, between 50$ to 51$ and at green support line. Resistance at the 50 DMA and Fibonacci appropriate levels.


NYSE : NEM chart


Freeport-McMoRan Copper & Gold Inc , NYSE : FCX

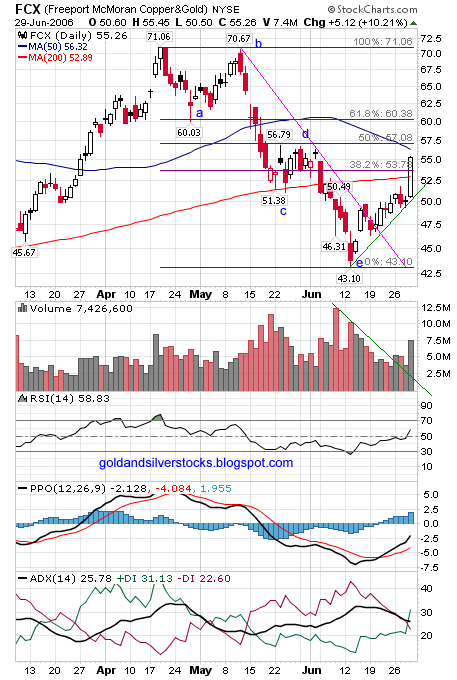
FCX – Topped early at mid April , had A-B-C-D-E correction wave(71.06$ - 43.10$), went below the 200 DMA then bounced sharply to close above the pink downtrend line. Currently above the first Fibonacci line just under the 50 DMA. Resistance at 50 DMA and Fibonacci levels. Support at the 200 DMA , Fibonnaci 38.2% level and green uptrend line. Big up day on good volume, RSI looking strong trending up above 50. PPO bullish crossover , PPO Histogram positive, ADX bullish crossover.


NYSE : FCX chart


Coeur d'Alene Mines Corporation , NYSE : CDE

CDE- A-B-C-D-E correction wave (7.37$ - 3.93$), currently still below the 200 DMA. Break up above orange downtrend line. Support at green uptrend line, Resistance at the 200 DMA. RSI trending up but still below 50, PPO positive crossover, PPO histogram positive, ADX Improving.

NYSE : CDE chart

Labels: , , , ,

Wednesday, June 28, 2006

BGO, MNG, MGN Charts Review

Bema Gold Corporation – (TSE / AMEX: BGO), AIM: BAU

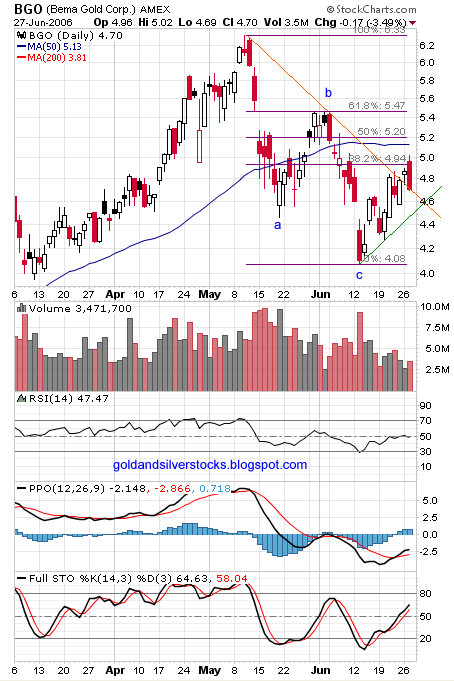
Bema – had the typical PMS A-B-C correction (6.33$ - 4.08$ ), break up above the downtrend line (orange). New uptrend = green line, RSI and Stochastic trading up. PPO crossover but still below zero, PPO histogram positive. Volume dried up.


The BGO label at the bottom of the post will take you to
previous related BGO posts.

BGO Chart


Miramar Mining Corporation (AMEX: MNG),(TSE: MAE)

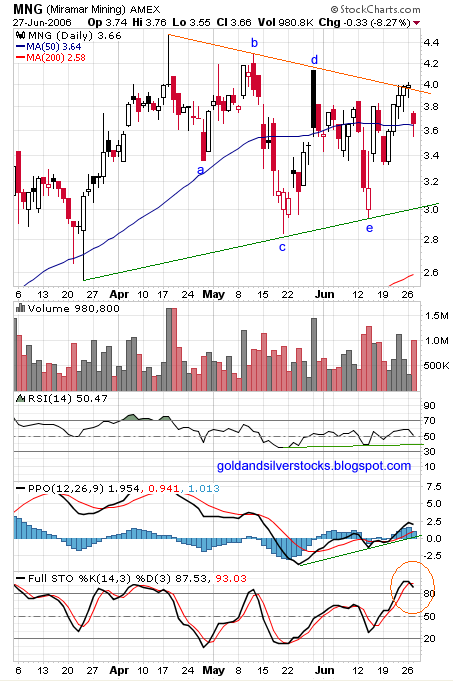
Miramar – A-B-C-D-E correction (4.48$ - 2.84$), (note: E > C). Symmetrical triangle pattern between the orange line - resistance and green –support. RSI a bit above 50 with slight uptrend since mid May. PPO crossover and trending up above zero. Stochastic at overbought territory with possible bearish crossover.


MNG Chart


Mines Management, Inc. (AMEX: MGN)

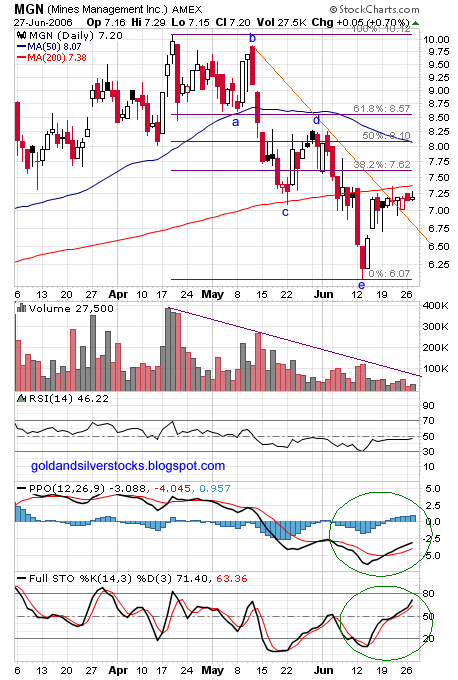
MGN - A-B-C-D-E correction (10.10$ - 6.07$). Break up above downtrend line(orange) stopped just under 200 DMA. Volume collapsed to extremely low level. RSI still below 50, PPO crossover, PPO histogram positive, stochastic trending up.


NGN Chart

Labels: , , , ,

Tuesday, June 27, 2006

MDG, ABX, PAAS, AEM - Chart Analysis

MDG(NYSE), Meridian Gold Inc. MNG(TSE)

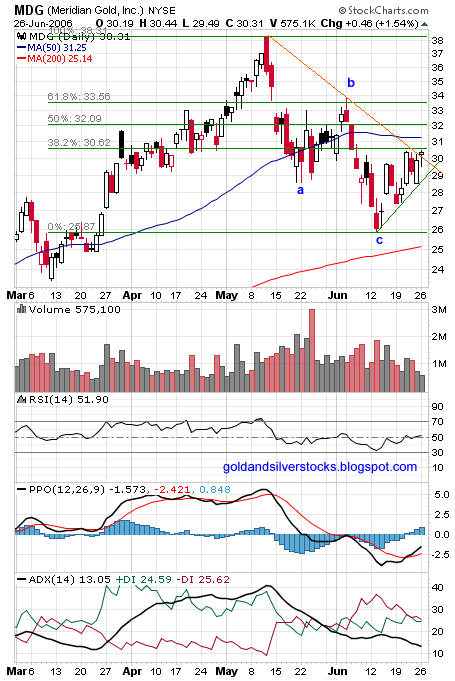
A-B-C correction (38.31 $ –25.86$), break up above downtrend resistance (orange line). Uptrend (green line), RSI above 50, PPO crossover, PPO histogram positive, ADX improving (almost positive).


MDG, Meridian Gold Inc. MNGChart


ABX (NYSE), Barrick Gold Corp. ABX(TSE)

A-B-C correction (35.90$ – 26.70$), break up above downtrend resistance (orange line).Uptrend (green lines), RSI improving, PPO minor crossover, PPO histogram slightly positive, ADX natural.


ABX, Barrick Gold Corp. Chart


PAAS (NASDAQ), Pan American Silver Corp. PAA(TSE)

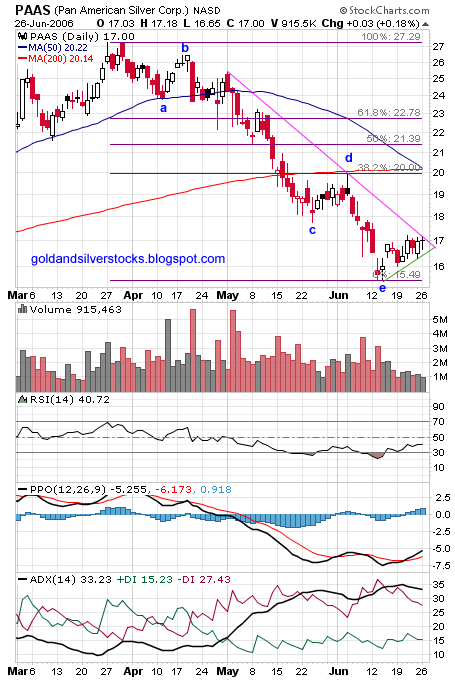
PAAS lost synchronization with other PMs for some reason. PAAS topped earlier (March), A-B-C-D-E correction vs. A-B-C (27.28$ – 15.49$),at downtrend resistance (pink line). Slight uptrend (green line) , RSI improving , PPO crossover , PPO histogram positive , ADX natural.

PAAS Pan American Silver Corp. PAA Chart


AEM (NYSE), Agnico-Eagle Mines Ltd. AEM(TSE)

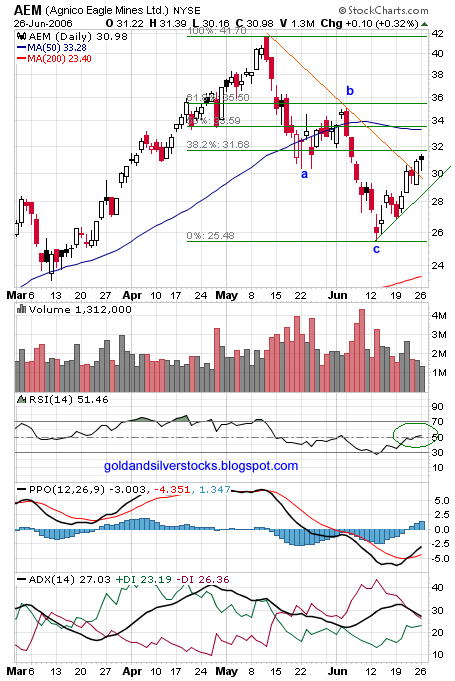
A-B-C correction (41.70 $ – 25.49$), break up above downtrend resistance (orange line).Uptrend (green line), RSI above 50, PPO crossover, PPO histogram positive, ADX improving.


AEM Agnico-Eagle Mines Ltd Chart


Free Elliot Wave Tutorial (For EWI club members).

Labels: , , , ,

Sunday, June 25, 2006

GG, SLW, AUY, TRE - Chart Analysis

GG(NYSE)- Goldcorp Inc. G(TSE)

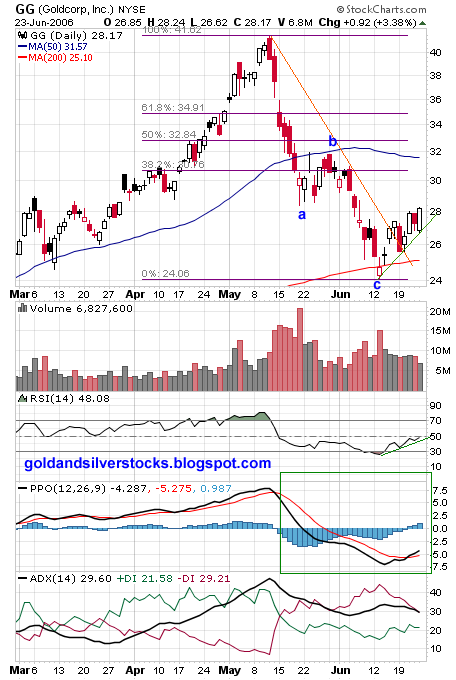
A-B-C correction (41.02$ – 24.06$), bounced from the 200 DMA (daily moving average), break up above downtrend resistance (orange line). Slight uptrend (green line) , RSI improving , PPO crossover , PPO histogram positive , ADX natural.


gg chart


SLW(NYSE)- Silver Wheaton Corporation, SLW(TSE)

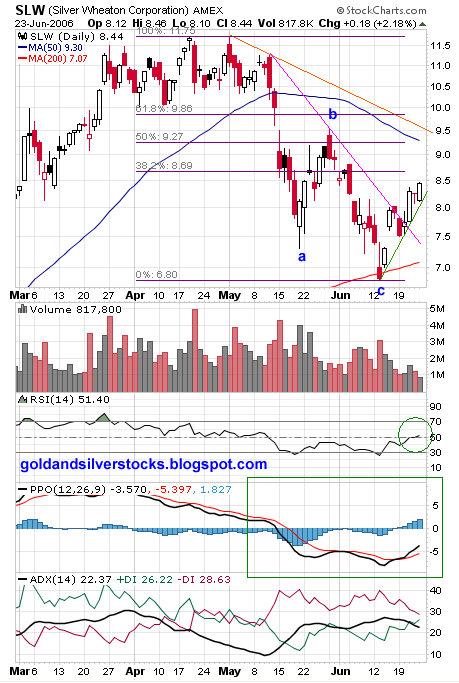
A-B-C correction (11.75 – 6.80), bounced from the 200 DMA, break up above downtrend resistance (pink line). Uptrend (green line), RSI improving above 50, PPO crossover, PPO histogram positive, ADX improving.


SLW chart


AUY(AMEX)- Yamana Gold Inc. YRI(TSE)

A-B-C correction (12.42 - 7.79), break up above downtrend resistance (green line). Uptrend (green line), RSI improving above 50, PPO crossover, PPO histogram positive, ADX improving.


TRE(AMEX)- Tanzanian Royalty Exploration, TNX(TSE)

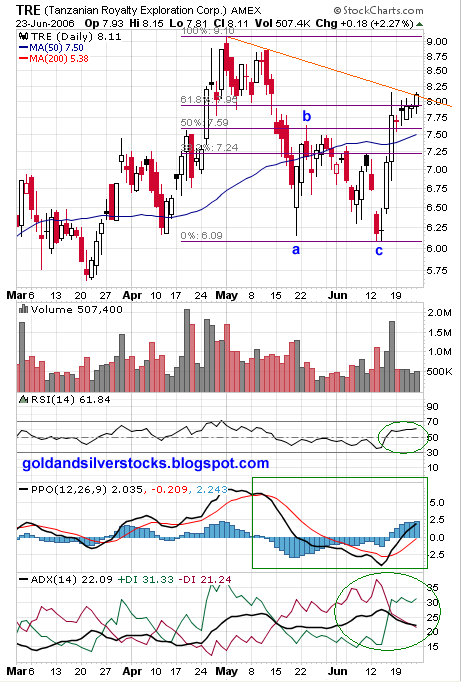
A-B-C correction (9.10 – 6.09), closed above the( b) high & 61.8% Fibonacci level, at downtrend resistance (orange line). RSI above 50, PPO crossover, PPO histogram positive, ADX positive.


tre chart

Labels: , , , ,

Friday, June 23, 2006

Gold Fields (GFI), Harmony Gold Mining (HMY)

It might be worth to look at South African miners like HMY & GFI which seems to lead right now probably due to Rand weakness.

Technically both charts of Harmony and Gold fields are showing a couple of bullish signs: Closed above the down trend resistance and 38.2% Fibonacci level on fine volume, RSI trending up above 50 ,PPO crossover & Improving ADX.

Gold Fields (GFI)chart


Harmony Gold Mining (HMY)chart

Labels: , , ,

Thursday, June 22, 2006

HUI – Buy Signals

HUI – the AMEX Gold Bugs Index is a basket of relatively unhedged gold miners. Gold Indices like the HUI tend to lead the price of gold. Technically I observe three buy signals on the short term daily chart:

1) Diagonal downtrend line (previous resistance) is broken to the upside.
2) RSI downtrend line is broken.
3) PPO Histogram showing positive divergence.

So, unless the A-B-C correction develops into A to E correction (unlikely) it is reasonable to assume that the HUI is headed higher. The May top (401.69) will get tested and Higher high is certainly a possibility.

The technical situation of other gold indices (XAU, GOX & GDM) is similar. Investors and traders can get exposure to gold mining equity with the GDX ETF.

Browse Gold and Silver Mining Stocks blog Archive. See gold and silver charts and commentary. Visit commodities blog.

AMEX Gold Bugs Index(HUI)

Labels: , ,

Wednesday, June 21, 2006

Gold Stocks ETF GDX & XGD

GDX is the Market Vectors Gold Miners ETF which tracks the GDM – AMEX Gold Miners Index. XGD is the iShares Canadian Gold Sector ETF which tracks the S&P/TSX Gold Index. Both ETFs allows investors and traders to gain diversified gold mining equity exposure. The main differences are: The XGD trades on the Canadian Toronto stock exchange and is priced with Canadian dollar while the GDX trades on the American stock exchange – AMEX and priced with US Dollar.

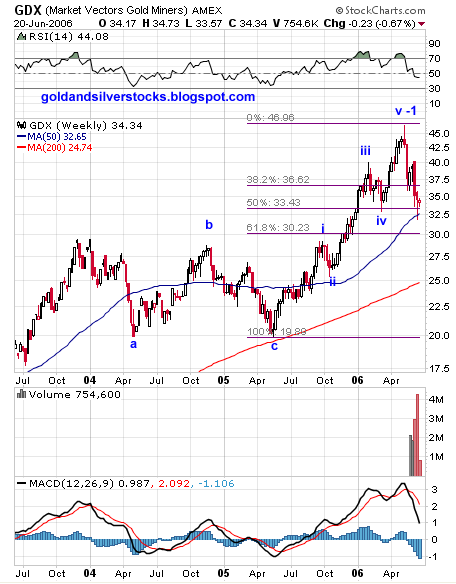
Long term (weekly chart) the XGD retraced about 61.8% of its recent up leg (wave 1) and bounced of the 2003 high. The GDX retraced about 50% of its recent up leg (wave 1) and bounced from the 50 weekly moving average zone.


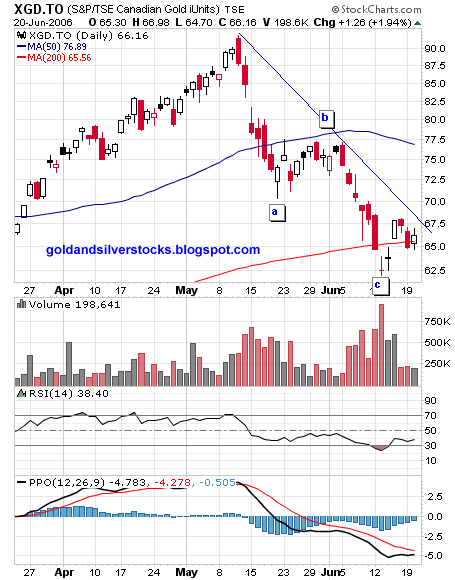
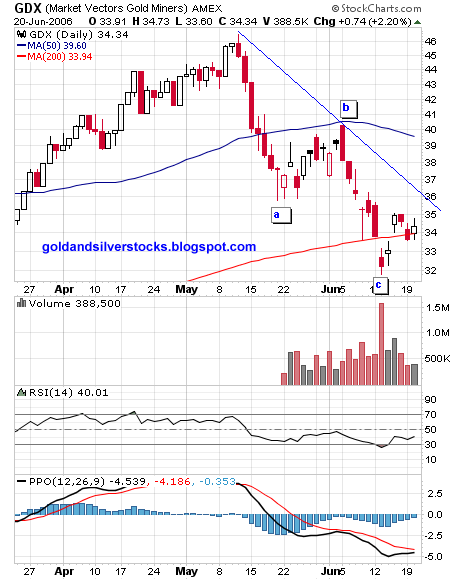
Short term both GDX and XGD had a A – B –C correction (wave 2) , resistance at the diagonal line – I expect a strong rally once the trend line is broken.

For free (needs short registration) Elliott wave tutorial see EWI.


XGD ETF weekly chart

GDX ETF weekly chart

XGD ETF daily chart

GDX ETF daily chart

Labels: , , , ,