


HUI - Amex Gold Bugs Index Elliott Wave Count
Here are some HUI - Amex Gold Bugs Index charts. The charts are annotated with Elliot wave's counts, Fibonacci support lines, moving averages, trend lines and other technical indicators. To put it simply: It is my opinion that the HUI is close or already had bottomed. Like Gold I think that the HUI will go much higher, however I think that at some point and under some circumstances the price of gold and / or the price of silver will outperform the HUI index.
HUI logarithmic weekly chart, bear market bottom to date - click on the chart below to enlarge:
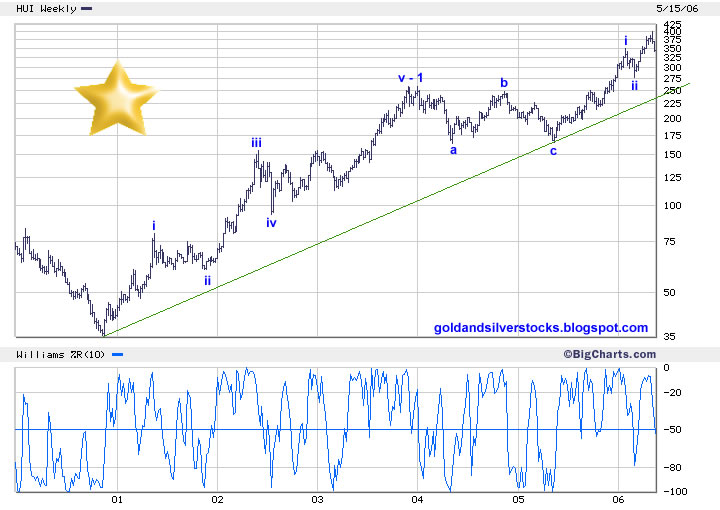
HUI linear weekly chart, bear market bottom to date - click on the chart below to enlarge:

HUI daily chart - one year
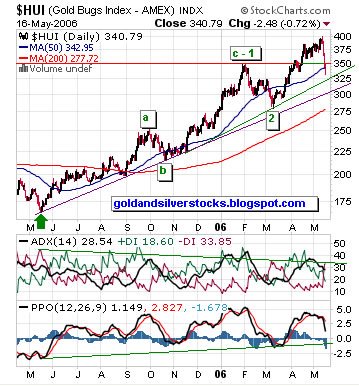
HUI daily chart - three month

- For Elliott Wave analysis I highly recommend the book: Elliott wave principle.
- See previous HUI Posts
- IF you need a Free Real time quotes and charts for Gold, Commodities, Forex, Indices & Stocks (registration is required) try ADVFN
- For viewing online charts, images and pictures I highly recommend the FireFox browser.
Labels: Elliott Wave, HUI
posted by troy @ 5/16/2006
![]()
![]()
0 Comments:
Post a Comment
<< Home