


BGO, MNG, MGN Charts Review
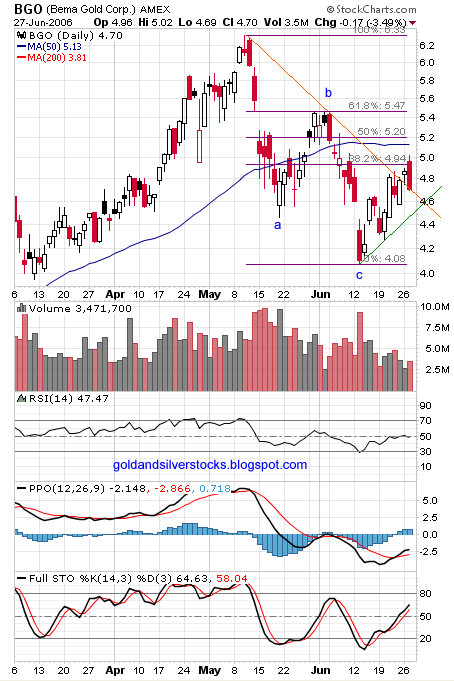
Bema Gold Corporation – (TSE / AMEX: BGO), AIM: BAU
Bema – had the typical PMS A-B-C correction (6.33$ - 4.08$ ), break up above the downtrend line (orange). New uptrend = green line, RSI and Stochastic trading up. PPO crossover but still below zero, PPO histogram positive. Volume dried up.
The BGO label at the bottom of the post will take you to
previous related BGO posts.
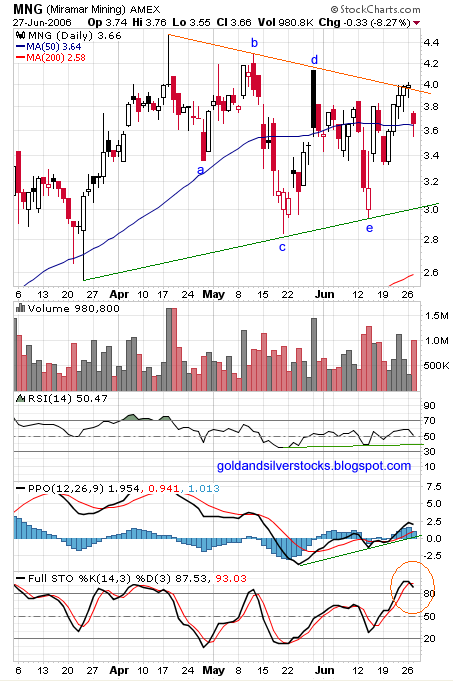
Miramar Mining Corporation (AMEX: MNG),(TSE: MAE)
Miramar – A-B-C-D-E correction (4.48$ - 2.84$), (note: E > C). Symmetrical triangle pattern between the orange line - resistance and green –support. RSI a bit above 50 with slight uptrend since mid May. PPO crossover and trending up above zero. Stochastic at overbought territory with possible bearish crossover.
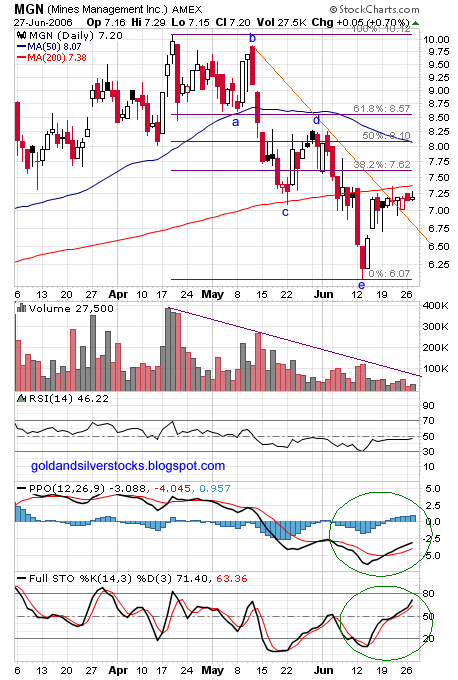
Mines Management, Inc. (AMEX: MGN)
MGN - A-B-C-D-E correction (10.10$ - 6.07$). Break up above downtrend line(orange) stopped just under 200 DMA. Volume collapsed to extremely low level. RSI still below 50, PPO crossover, PPO histogram positive, stochastic trending up.
Labels: BGO, Elliott Wave, Fibonacci, MGN, MNG
posted by troy @ 6/28/2006
![]()
![]()
0 Comments:
Post a Comment
<< Home