


MDG, ABX, PAAS, AEM - Chart Analysis
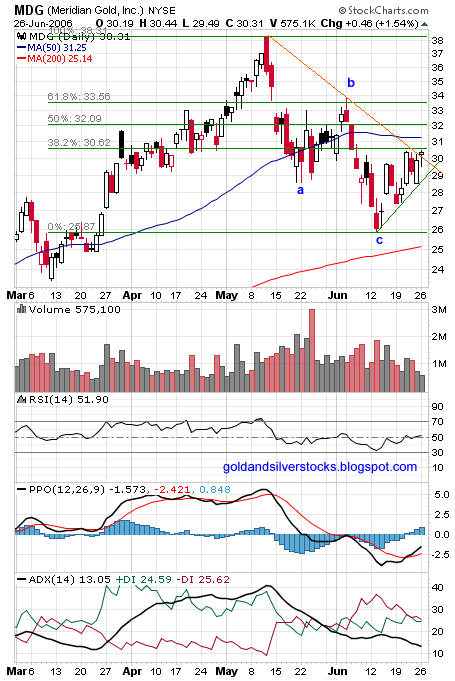
MDG(NYSE), Meridian Gold Inc. MNG(TSE)
A-B-C correction (38.31 $ –25.86$), break up above downtrend resistance (orange line). Uptrend (green line), RSI above 50, PPO crossover, PPO histogram positive, ADX improving (almost positive).
ABX (NYSE), Barrick Gold Corp. ABX(TSE)
A-B-C correction (35.90$ – 26.70$), break up above downtrend resistance (orange line).Uptrend (green lines), RSI improving, PPO minor crossover, PPO histogram slightly positive, ADX natural.

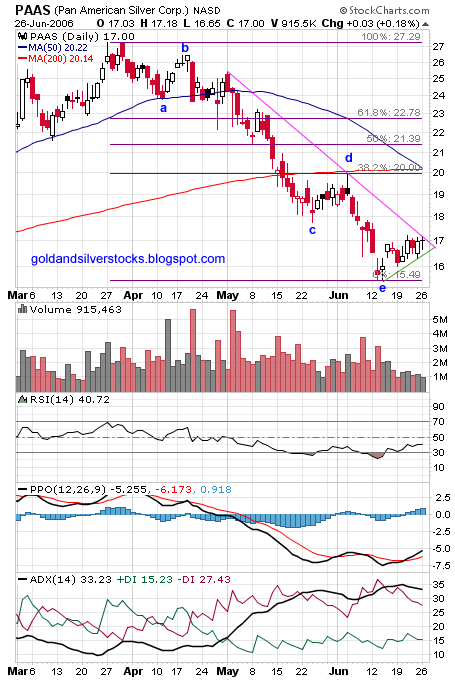
PAAS (NASDAQ), Pan American Silver Corp. PAA(TSE)
PAAS lost synchronization with other PMs for some reason. PAAS topped earlier (March), A-B-C-D-E correction vs. A-B-C (27.28$ – 15.49$),at downtrend resistance (pink line). Slight uptrend (green line) , RSI improving , PPO crossover , PPO histogram positive , ADX natural.
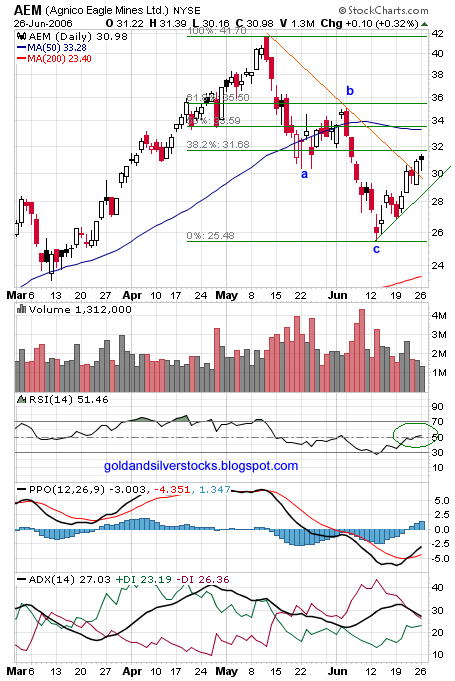
AEM (NYSE), Agnico-Eagle Mines Ltd. AEM(TSE)
A-B-C correction (41.70 $ – 25.49$), break up above downtrend resistance (orange line).Uptrend (green line), RSI above 50, PPO crossover, PPO histogram positive, ADX improving.
Free Elliot Wave Tutorial (For EWI club members).
Labels: ABX, AEM, Elliott Wave, MDG, PAAS
posted by troy @ 6/27/2006
![]()
![]()
0 Comments:
Post a Comment
<< Home