


DROOY, KRY
J.R requested my opinion on two stocks:
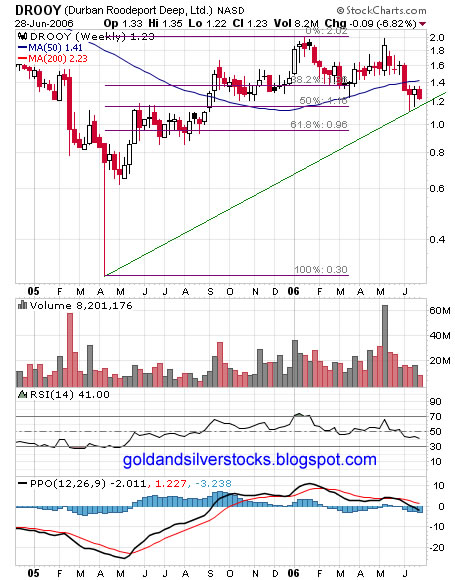
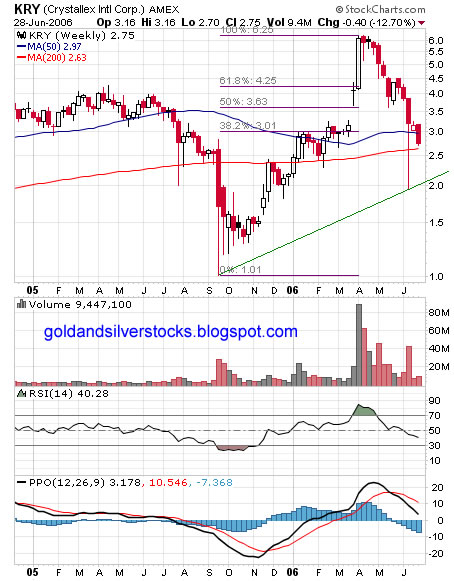
DRDGOLD Limited, (NASDAQ:DROOY) and Crystallex International Corp. (AMEX; TSE: KRY)
DROOY – the stock have been underperforming gold and gold indices for quiet some time, it crashed to as low as 0.30$ then rallied to 2.02$. I recognize a potential head and shoulders pattern with a price target of about 0.40$. Currently trading below the 50 WMA (weekly moving average), RSI trending down below 50, PPO Bearish crossover, PPO histogram negative. Watch out if the support line (green) fails to hold.
KRY- In less then a year the stock rallied from 1.01$ to as high as 6.25$ only to crash back to 2$. Currently trading below the 50 WMA, RSI trending down below 50, PPO bearish crossover, PPO histogram negative. If it goes under the 200 WMA then the green support line probably get tested.
Over all both charts are highly disordered reflecting extremely high risks!
See also : Special risks when investing in a mining company
If you want to suggest gold, silver or metal stocks for review - let me know
posted by troy @ 6/29/2006
![]()
![]()
2 Comments:
Real, thanks for the chart on KRY. I'm stuggling with this one as I want to follow technical indicators, but feel I have to maintain a position in case the news of the final permit is released. This one news fact could have a huge effect on the stock and is the biggest reason I'm trading it.
So the struggle is to find a balance between gambling on that news and not losing too much money in the short term.
Of course, I could just look for better deals where I can gamble on a stock with good technicals.
Some times the chart will predict the news, regarding KRY, I hold no position and that is just my natural observation for what it worth, I do not advocate buy or sell.
Good luck!
Post a Comment
<< Home