Tuesday, June 27, 2006

MDG, ABX, PAAS, AEM - Chart Analysis

MDG(NYSE), Meridian Gold Inc. MNG(TSE)

A-B-C correction (38.31 $ –25.86$), break up above downtrend resistance (orange line). Uptrend (green line), RSI above 50, PPO crossover, PPO histogram positive, ADX improving (almost positive).
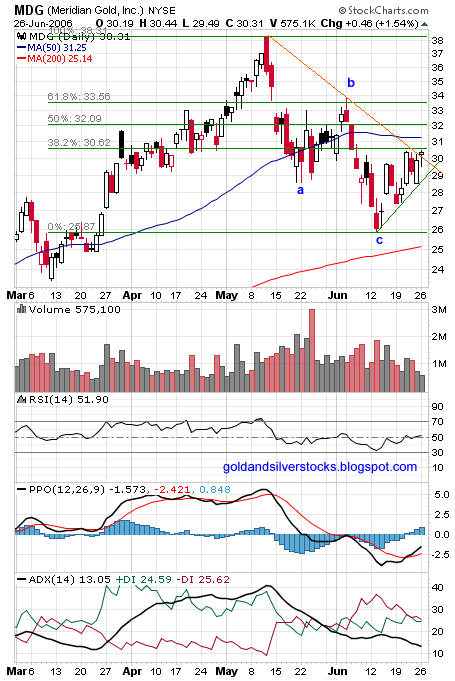

MDG, Meridian Gold Inc. MNGChart


ABX (NYSE), Barrick Gold Corp. ABX(TSE)

A-B-C correction (35.90$ – 26.70$), break up above downtrend resistance (orange line).Uptrend (green lines), RSI improving, PPO minor crossover, PPO histogram slightly positive, ADX natural.


ABX, Barrick Gold Corp. Chart


PAAS (NASDAQ), Pan American Silver Corp. PAA(TSE)

PAAS lost synchronization with other PMs for some reason. PAAS topped earlier (March), A-B-C-D-E correction vs. A-B-C (27.28$ – 15.49$),at downtrend resistance (pink line). Slight uptrend (green line) , RSI improving , PPO crossover , PPO histogram positive , ADX natural.
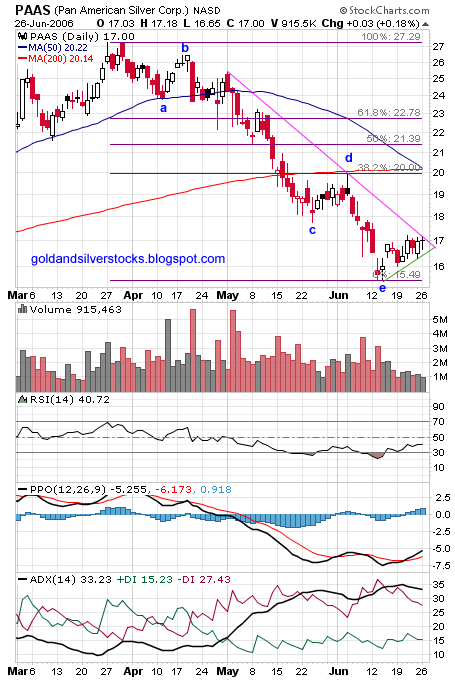
PAAS Pan American Silver Corp. PAA Chart


AEM (NYSE), Agnico-Eagle Mines Ltd. AEM(TSE)

A-B-C correction (41.70 $ – 25.49$), break up above downtrend resistance (orange line).Uptrend (green line), RSI above 50, PPO crossover, PPO histogram positive, ADX improving.
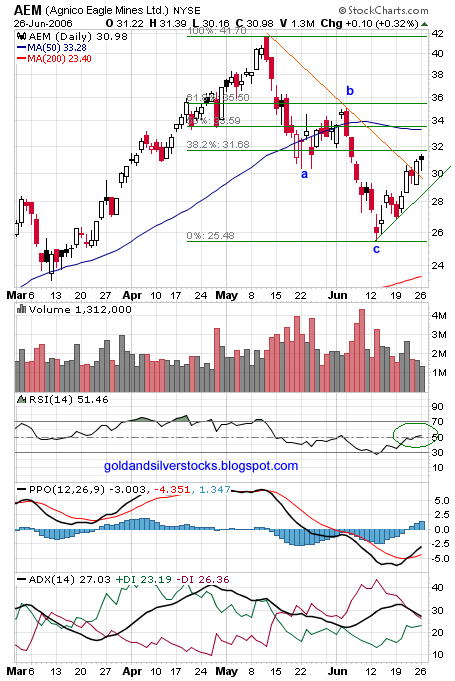

AEM Agnico-Eagle Mines Ltd Chart


Free Elliot Wave Tutorial (For EWI club members).

Labels: , , , ,

Tuesday, May 23, 2006

Pan American Silver Corp. NASDAQ : PAAS

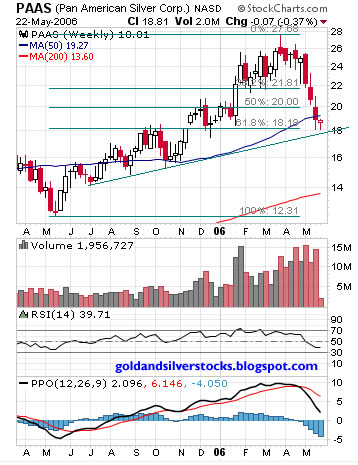
PAAS retraced 61.8% of the latest move up and seems to have support at the Fibonacci 61.8% support level, along a slight uptrend trend line. Pan American Silver is a Component of the XAU Index.

See possibly related previous PAAS posts.

See my latest Spot silver technical analysis.

Pan American Silver Corp. NASDAQ : PAAS weekly chart

Labels: ,

Tuesday, March 28, 2006

Pan American Silver Corp. (NASDAQ : PAAS)

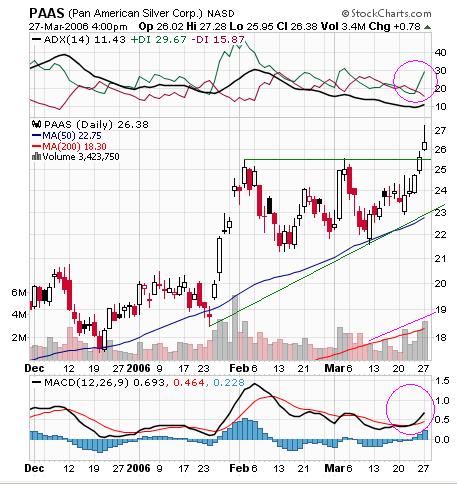
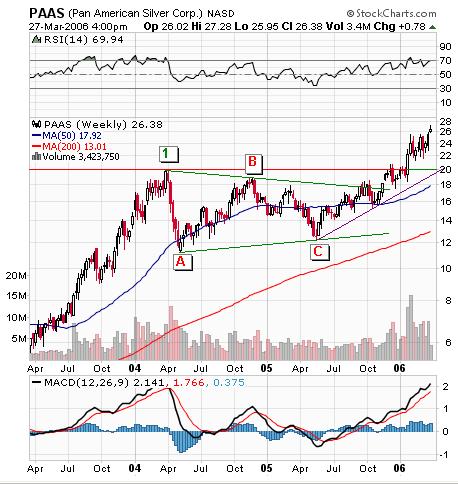
PAAS is one of the few mature silver stocks, famous Bill Gates is known to be the largest single holder (CASCADE INVESTMENT LLC). PAAS is trading around all time highs and technically there is no overhead resistance. The triangle pattern on the daily chart suggests a price objective of 32$. ADX & MACD are looking good, the weekly chart also looks good and I believe that regardless of any short term pullback that may or may not come this stock is headed higher after consolidating for almost two years.


Pan American Silver Corp. (NASDAQ : PAAS) chart

Pan American Silver Corp. (NASDAQ : PAAS) chart

Labels:

Wednesday, February 08, 2006

Pan American Silver Corp. NASDAQ : PAAS

Profile

Pan American Silver Corp. was founded in 1994 upon a single mission: to be the best vehicle for equity investors wanting real exposure to higher silver prices. Today, the Company produces more than 13 million ounces of silver annually from 6 operations in 3 countries, it has its seventh mine under construction in Mexico, and an additional silver project undergoing a feasibility study in Argentina. Pan American Silver expects to become the largest primary silver producer in the world with annual silver production growing to 23 million ounces in 2008.

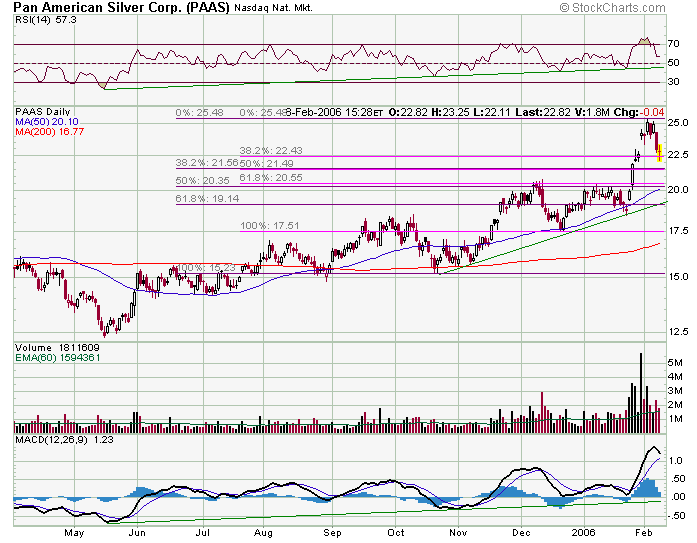
Click on the charts below to enlarge:

Pan American Silver Corp. NASDAQ : PAAS

Pan American Silver Corp. NASDAQ : PAAS

Labels: