


GDX – Gold Miners ETF
The GDX along the XGD is excellent trading / investment tool which enable both positive and negative diversified exposure to the gold mining industry.
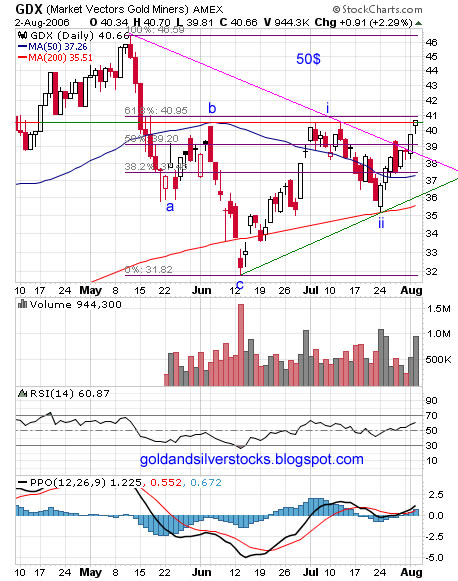
Technically, breakout above the diagonal pink resistance line (currently support), slight resistance at the 61.8% Fibonacci line. Inverted head and shoulders pattern with price target of 50$. For practical objectives the same analysis is good for other gold miners indices.
Technical indicators: RSI trending up above 50, PPO bullish crossover, positive PPO histogram.
Support : Fibonacci lines below the current price , pink and green trend lines.
Resistance: 61.8% Fibonacci line, 43$ and the May high.
Labels: Elliott Wave, Fibonacci, GDM, GDX
posted by troy @ 8/03/2006
![]()
![]()
0 Comments:
Post a Comment
<< Home