NEM, FCX, CDE - Chart Reviews
Newmont Mining Corporation , NYSE : NEM
NEM - Typical A-B-C correction wave (59.59$ - 47.34$), went below the 200 DMA. Yesterday managed to break above the pink downtrend line, close above the 200 DMA and the 61,8% Fibonacci line. RSI trending up above 50, PPO positive crossover, PPO histogram positive, ADX bullish crossover. Nice candle on relatively high volume. Support at the 200 DMA, between 50$ to 51$ and at green support line. Resistance at the 50 DMA and Fibonacci appropriate levels.

Freeport-McMoRan Copper & Gold Inc , NYSE : FCX
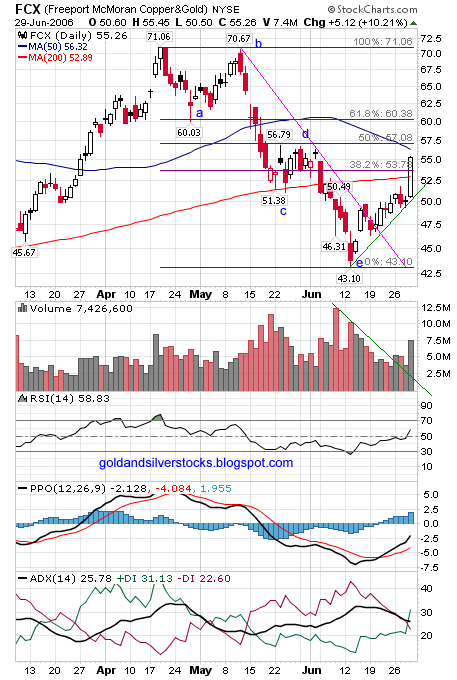
FCX – Topped early at mid April , had A-B-C-D-E correction wave(71.06$ - 43.10$), went below the 200 DMA then bounced sharply to close above the pink downtrend line. Currently above the first Fibonacci line just under the 50 DMA. Resistance at 50 DMA and Fibonacci levels. Support at the 200 DMA , Fibonnaci 38.2% level and green uptrend line. Big up day on good volume, RSI looking strong trending up above 50. PPO bullish crossover , PPO Histogram positive, ADX bullish crossover.

Coeur d'Alene Mines Corporation , NYSE : CDE
CDE- A-B-C-D-E correction wave (7.37$ - 3.93$), currently still below the 200 DMA. Break up above orange downtrend line. Support at green uptrend line, Resistance at the 200 DMA. RSI trending up but still below 50, PPO positive crossover, PPO histogram positive, ADX Improving.

Labels: CDE, Elliott Wave, FCX, Fibonacci, NEM


2 Comments:
The A-B-C correction is very apparent with VGZ (Vista Gold Corp):
[Link]
Thanks B_W , I will look into it.
Post a Comment
<< Home