Saturday, June 23, 2007

HUI Update

Yet another Breakout attempt, the HUI managed to climb above short term diagonal trend line resistance. A retest of the broken trend lined and 200 DMA followed.

Support around recent cycle low 317.70 further support at previous cycle low 311.78.

Technical indicators: RSI slightly above 50, PPO had a bullish crossover and seems to be trending higher.


hui chart


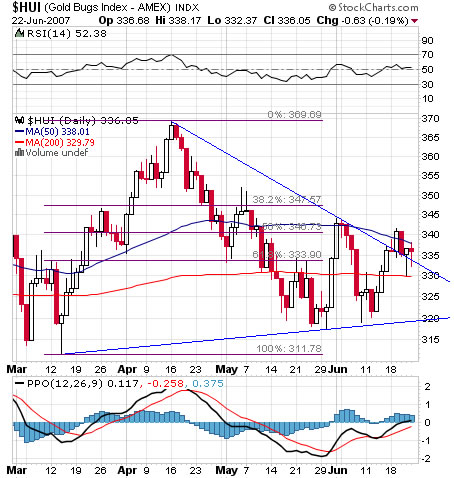
It is likely that if the HUI can trade above 344.07 it will aim to 369.69 and further.


The bigger picture: the HUI, Gold, Silver, Etc. - All consolidated for a long period of time so giving a chance to the small technical improvement might be a wise thing to do.

Some index components enjoy a relatively high level of short interest ratio.

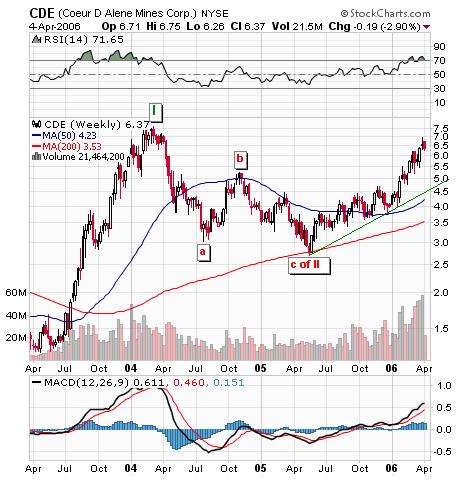
ShortSqueeze.com data : Eldorado Gold (EGO), Randgold Resources(GOLD) ,Coeur dAlene Mines(CDE), Hecla Mining Company (HL) ,Golden Star Resources(GSS), IAMGOLD(IAG).

Check them out (fundamentals ,TA. Etc) – they might be a good play.

Labels: , , , , , ,

Friday, June 30, 2006

NEM, FCX, CDE - Chart Reviews

Newmont Mining Corporation , NYSE : NEM

NEM - Typical A-B-C correction wave (59.59$ - 47.34$), went below the 200 DMA. Yesterday managed to break above the pink downtrend line, close above the 200 DMA and the 61,8% Fibonacci line. RSI trending up above 50, PPO positive crossover, PPO histogram positive, ADX bullish crossover. Nice candle on relatively high volume. Support at the 200 DMA, between 50$ to 51$ and at green support line. Resistance at the 50 DMA and Fibonacci appropriate levels.


NYSE : NEM chart


Freeport-McMoRan Copper & Gold Inc , NYSE : FCX

FCX – Topped early at mid April , had A-B-C-D-E correction wave(71.06$ - 43.10$), went below the 200 DMA then bounced sharply to close above the pink downtrend line. Currently above the first Fibonacci line just under the 50 DMA. Resistance at 50 DMA and Fibonacci levels. Support at the 200 DMA , Fibonnaci 38.2% level and green uptrend line. Big up day on good volume, RSI looking strong trending up above 50. PPO bullish crossover , PPO Histogram positive, ADX bullish crossover.


NYSE : FCX chart


Coeur d'Alene Mines Corporation , NYSE : CDE

CDE- A-B-C-D-E correction wave (7.37$ - 3.93$), currently still below the 200 DMA. Break up above orange downtrend line. Support at green uptrend line, Resistance at the 200 DMA. RSI trending up but still below 50, PPO positive crossover, PPO histogram positive, ADX Improving.

NYSE : CDE chart

Labels: , , , ,

Tuesday, April 04, 2006

Coeur d'Alene Mines Corp. (CDE), (TSX:CDM) Review

Coeur d' Alene Mines Corporation (NYSE:CDE / TSX:CDM) is the world's largest publicly traded primary silver producer. In 2005, the Company produced almost 14 million ounces of silver and more than 130,000 ounces of gold at a cash operating cost of approximately $4.26 per ounce of silver.

Coeur has two of the largest silver mines in the U.S.; two expanding low-cost mines in southern Chile and Argentina; two low-cost mines in Australia and two advanced development projects, in Bolivia and Alaska. Coeur also owns large land positions around its two South American mines, where major exploration is ongoing in 2006.

The Company has no silver or gold production hedged.

CDE is certainly not the hottest silver stock you can find, CDE is still trading below the first Elliot wave high (Q1 2004). However the volume is decent and its worth to keep an eye on it and look for a possible entry point. Off course it all depends on the price of silver, but with silver going higher It will be reasonable to assume that Coeur d' Alene Mines Corporation will be able to surpass the Q1 2004 high.

Coeur d' Alene Mines Corporation (NYSE:CDE / TSX:CDM) chart

Coeur d' Alene Mines Corporation (NYSE:CDE / TSX:CDM) chart

Labels: ,