


Gold Bug Index (HUI) Charts
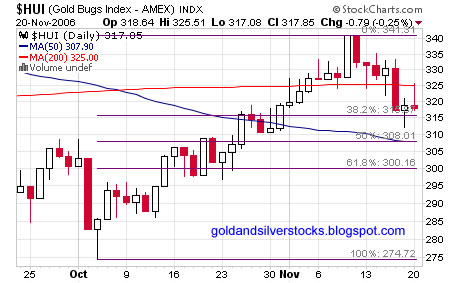
The HUI is currently priced between its 50 and 200 daily moving averages.
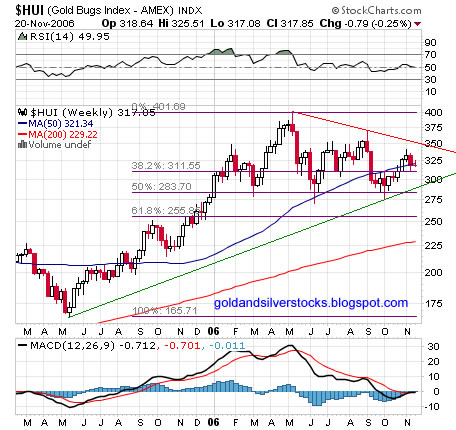
Daily and weekly chart below are self explaining. Close above 350 will indicate that the HUI is headed to new highs; a break below 290 will signal that more consolidation is needed. Technical indicators on the weekly chart are natural.
posted by troy @ 11/21/2006
0 comments
![]()
![]()