Well, I'm certainly not a general equity bull and hence not surprised of the recent (ongoing?) global equity market drop. I did also forecast a certain amount of weakness for
metals,
commodities and precious metals shares. So anyone following my posting got several warnings.
However when I examine the gold, silver, precious metals stocks and various ratio charts the picture is mixed.
Some bearish signs: major miners (which are heavily weighted into gold mining indices) Barrick Gold (ABX), Newmont Mining (NEM), Goldcorp (GG) are making new lows for 2007 and the charts look like they can slide lower. XGD the Canadian gold miners ETF, $XAU – both closed at a new low for 2007
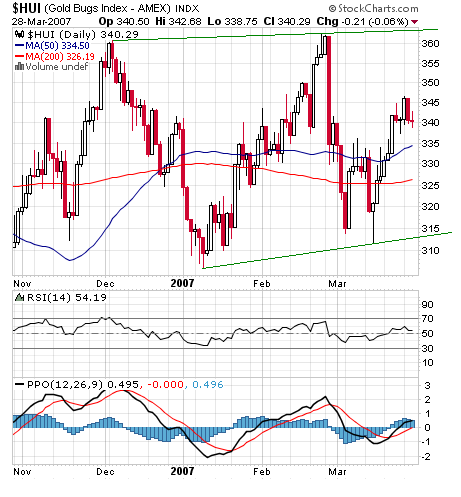
Some bullish signs: The gold & silver charts do not look that bad (yet), the HUI continue to outperform the heavy hedged XAU. Some juniors are outperforming as
Stacy M. Himes Posted.I favor holding good long term gold, silver and precious metals shares positions, be in a wait and see position, do not capitulate! , do not seat and wait like a duck for your stops to be taken, don't be shy to take partial profits, If you can't stand the volatility then decrease your positions.
Good Luck
Labels: XAU, XGD