Thursday, April 27, 2006

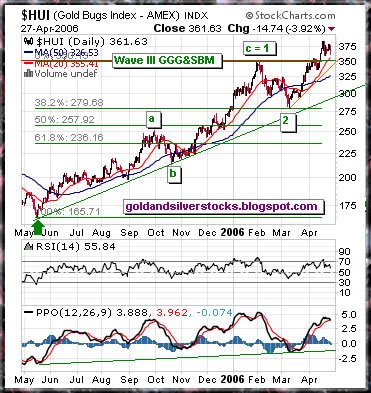
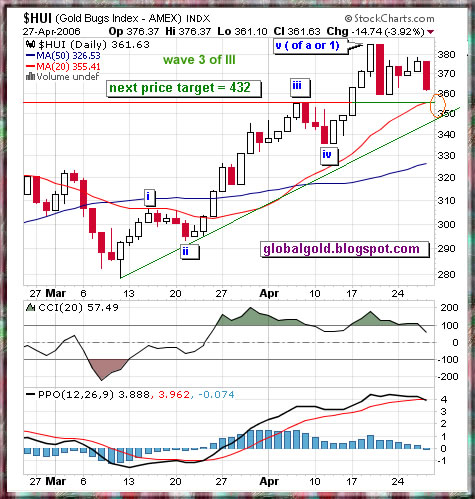
HUI – Amex Gold Bug Index E – Waves

The HUI is up around 120% since the second leg (Elliott Wave III) of the Great Global Gold & Silver Bull Market started at May 2005. However, there is still a lot of upside potential. Short term it seems like a minor ( 2 or b) correction is taking place.


Related:

HUI components, Gold & Silver Spot Charts, Platinum Long Term Charts , More HUI posts , Ralph Nelson Elliott biography.


HUI – Amex Gold Bug Index chart

HUI – Amex Gold Bug Index

Labels: ,

DRDGOLD Ltd. (NASDAQ: DROOY)

DRDGOLD Ltd. (NASDAQ: DROOY) established in 1895 as Durban Roodepoort Deep, Limited to exploit the South Africa’s Witwatersrand Basin, renamed in 2004 to DRDGOLD.

At 30 June 2005, the attributable mineral resource base was 36.6 million ounces, and attributable ore reserves were 6.6 million ounces.

DRDGOLD has acquired a strategic 50.2% interest in a subsidiary of the internet-based gold investment company, GM Network Limited (GoldMoney.com).

JSE: DUR , Australia: DRD (de listed) , Nasdaq: DROOY , Brussels: DUR , Paris: DUR , Berlin: DUB , London: DBNR , Frankfurt: DUB .

Listing on several exchanges doesnt necessarily means higher stock price...

DRDGOLD Ltd. (NASDAQ: DROOY) weekly chart

DRDGOLD Ltd. (NASDAQ: DROOY) long term chart


http://www.drdgold.com

Gold & Silver Spot chart

Labels:

Tuesday, April 25, 2006

SILVER WHEATON CORP (AMEX: SLW) Follow-through

Since the last SLW review(Silver Wheaton March 27) SLW have been consolidating / stagnating around the 10$ - 11.50$ range , almost unaffected by the silver price correction.


Daily chart

SILVER WHEATON CORP (AMEX: SLW) candle chart


All time data (TSX: SLW)
SILVER WHEATON CORP (TSX: SLW) long term chart


All time data (AMEX: SLW)
SILVER WHEATON CORP (AMEX: SLW) long term chart


http://www.silverwheaton.com/


XAU , XAG charts

Labels:

Wednesday, April 19, 2006

PHLX Gold & Silver Sector (XAU) , New High + Charts

XAU is a capitalization-weighted index composed of 16 companies involved in the gold and silver mining industry. XAU was set to an initial value of 100 in January 1979; options commenced trading on December 19, 1983.

XAU is a lagging gold index; the Amex Gold BUGS Index (HUI) is performing much better in this great global gold bull market. Any way the XAU made a new (all time?) high today.

PHLX Gold & Silver Sector (XAU) chart


PHLX Gold & Silver Sector (XAU)long term chart


WWW PHLX Gold & Silver Sector XAU

Components

WWW Barrick Gold Corp. ABX
WWW Agnico Eagle Mines Ltd. AEM
WWW AngloGold Ashanti Ltd. AU
WWW Bema Gold Corporation BGO
WWW Coeur D'Alene Mines Corporation CDE
WWW Freeport McMoran Copper Gold FCX
WWW Gold Fields Ltd. GFI
WWW Goldcorp Inc. GG
WWW Glamis Gold Ltd. GLG
WWW Randgold Resources Ltd. GOLD
WWW Harmony Gold Mining Co. Ltd. HMY
WWW Kinross Gold KGC
WWW Meridian Gold, Inc MDG
WWW Newmont Mining Corporation NEM
WWW Pan American Silver Corp. PAAS
WWW Royal Gold, Inc. RGLD

Labels: ,

Golden Star Resources Ltd. (TSE:GSC) , (AMEX:GSS)

Golden Star is a gold mining and exploration company with its operating mines on the prolific Ashanti Gold Belt in Ghana, West Africa. South American exploration.
At year-end 2005, Golden Star had 4.05 million ounces in reserves and, in addition, 200% more than that in its resource categories, all within trucking distance of current processing plants. The reserves and resources were estimated at gold prices of $400 and $480 per ounce respectively.


http://www.gsr.com/

Golden Star Resources Ltd (AMEX:GSS)

Golden Star Resources Ltd.  (TSE:GSC) ,   (AMEX:GSS)daily chart

Golden Star Resources Ltd.  (TSE:GSC) ,   (AMEX:GSS) weekly chart


Golden Star Resources Ltd. (TSE:GSC)

Golden Star Resources Ltd.  (TSE:GSC) ,   (AMEX:GSS) long term monthly chart

Labels:

Tuesday, April 18, 2006

Eldorado Gold Corporation ,EGO , ELD

Eldorado Gold Corporation a Canadian gold producing company, active in development and exploration, producing gold assets in Brazil and Turkey.

http://www.eldoradogold.com

Eldorado Gold Corporation AMEX:EGO, TSE:ELD.

ELD is on the S&P/TSX Gold Index and EGO is part of the AMEX Gold BUGS Index (HUI).

See Elliot wave count for Eldorado , currently at wave 5 of 1 of III in my opinion.

Eldorado Gold Corporation AMEX:EGO , TSE:ELD Chart

Eldorado Gold Corporation AMEX:EGO , TSE:ELD Chart


Eldorado Gold Corporation AMEX:EGO , TSE:ELD long term Chart


Commodities charts , Gold Global Perspective

Labels: ,

Sunday, April 16, 2006

IAMGOLD Corporation (NYSE:IAG), (TSX:IMG) & (ASX:IGD)

IAMGOLD Corporation is a Canadian gold mining and exploration company with operations in West Africa and South America. IAMGOLD assets include part ownership interest in four operating gold mines: 38% in Sadiola Gold Mine, 40% in Yatela Gold Mine both located n Mali, and 18.9% in both Tarkwa Gold Mine and Damang Gold Mine, located in Ghana..

IAMGOLD Corporation is listed on the Toronto Stock Exchange (TSX:IMG) , New York Sock Exchange (NYSE:IAG) & Australian Stock Exchange (ASX:IGD)

Technically: the Weekly chart - ascending triangle pattern, initial target of ~ 13$. The daily chart - pattern of symmetrical triangle and the price is just above the 50 DMA and the upper diagonal line.

IAMGOLD Corporation (NYSE:IAG) , (TSX:IMG) & (ASX:IGD) daily chart

IAMGOLD Corporation (NYSE:IAG) , (TSX:IMG) & (ASX:IGD) weekly chart

IAMGOLD Corporation (NYSE:IAG) , (TSX:IMG) & (ASX:IGD) long term chart

Labels:

Friday, April 14, 2006

Silver Standard Resources Inc. (NASDAQ: SSRI) , (TSE: SSO)

Silver Standard Resources Inc. is a Canadian silver mining company focused on the acquisition, exploration and development of silver dominant projects. Silver Standard Resources Inc. properties are located in Argentina, Mexico, Australia, Chile, the United States, Peru and Canada. Total Silver Resources (in millions of oz.): Measured: 88.7; Indicated: 474.0; Inferred: 554.3 (at March 22, 2006)

NASDAQ (SSRI) , Toronto Stock exchange (TSE: SSO)

Silver Standard Resources Inc. NASDAQ (SSRI) chart

Silver Standard Resources Inc. NASDAQ (SSRI) long term chart

Silver Standard Resources Inc. Toronto Stock exchange (TSE: SSO) long term chart

Labels:

Thursday, April 13, 2006

Harmony Gold Mining Co. (NYSE:HMY)

Harmony Gold Mining Company Limited was formed in 1950 as a Rand Mines managed company to exploit the single Harmony mine lease. In 1995, the company was set as separate entity following the demise of Rand Mines. Harmony mining gold in South Africa, Australia and Papua New Guinea.

Today, Harmony is the sixth largest producer in the world, with growth potential in South Africa and Australasia. In FY05, Harmony produced 3 million ounces of gold, predominantly from South African sources.

Harmony Gold Mining Co. (NYSE:HMY)  chart

Harmony Gold Mining Co. (NYSE:HMY)  long term chart

Harmony Gold Mining Company Limited website link

Labels:

Randgold Resources Ltd. (GOLD)

Randgold Resources (GOLD) engages in the mining, exploration, and development of mineral properties, primarily gold principally in West and East Africa. Its properties include Loulo mine, located in Mali; and Tongon project located in Cote d'Ivoire.

LSE : RRS , NASDAQ : Gold.

Randgold Resources Ltd. (GOLD) website


Randgold Resources Ltd. (GOLD) chart


Randgold Resources Ltd. (GOLD) long term chart

Labels:

Tuesday, April 11, 2006

Barrick Gold Corp. (NYSE: ABX)

Barrick(Completes Acquisition of Placer Dome) is the largest gold producer in the world; the company has the largest reserves in the industry ~139 million ounces as at December 31, 2005. For 2006, the Company’s guidance is gold production of 8.6 to 8.9 million ounces. According to the latest Mitsui / Haliburton / Virtual Metals Q405 Hedge Book Report. Barrick Gold + Placer Dome hedge position = 19,996,000 Gold ounces.

Gold Hedge position review(Short positions)


Barrick shares are traded on the Toronto (TSX: ABX), New York (NYSE: ABX), London (LSE: BGD), Euronext-Paris (PARIS: ABX) and Swiss (Swiss: ABX) stock exchanges.


Barrick Gold Corp.  (NYSE: ABX) long term chart
Barrick Gold Corp.  (TSX: ABX)  chart

Labels:

Sunday, April 09, 2006

Palladium & Ethanol Stocks

Palladium is a partial substitute of Platinum and Gold. Ethanol is a partial substitute of crude oil.

Here are few key stocks which are related to Palladium and Ethanol.


Stillwater Mining Company (NYSE: SWC)


Stillwater Mining is a producer of platinum group metals (PGMs) and a significant primary producer of palladium in the Western Hemisphere.

Stillwater Mining Company (NYSE: SWC) website


Stillwater Mining Company (NYSE: SWC)

Stillwater Mining Company (NYSE: SWC)


North American Palladium (AMEX: PAL)

North American Palladium Ltd. is a Canadian primary producer of palladium. The Company's Lac des Iles open pit mine also produces by-products of platinum, gold, copper and nickel.


North American Palladium (AMEX: PAL) website


North American Palladium (AMEX: PAL)

North American Palladium (AMEX: PAL)


Pacific Ethanol Inc (NASDAQ: PEIX)

Pacific Ethanol Inc.'s mission is to become the West Coast's leading marketer and producer of renewable fuels. Our product line currently emphasizes clean-burning corn-based ethanol. With over twenty years of experience in biofuels development, we are strategically poised to meet the explosive demand for domestically sourced alternative fuels. Bill Gates(CASCADE INVESTMENT LLC) is a major stake holder.

Pacific Ethanol Inc (NASDAQ: PEIX) website

Pacific Ethanol Inc  (NASDAQ: PEIX)

Pacific Ethanol Inc  (NASDAQ: PEIX)

Green Plains Renewable Energy Inc. (NASD: GPRE)

Green Plains (Recent IPO) is an energy consulting company based in Delaware, USA, promotes and facilitates the use of renewable energy and energy efficiency technologies. dealing with Photovoltaic, Solar Thermal, Geothermal ,Wind and Biomass.

Green Plains Renewable Energy Inc. (NASD: GPRE) website

Green Plains Renewable Energy Inc. (NASD: GPRE)

Labels: , , , , ,

Glamis Gold Ltd, GLG

Glamis Gold Ltd is a gold producer with low-cost production, and a strong growth profile. The Company’s near-term strategic goal is to produce 700,000 ounces of gold annually by 2007 at a total cash cost below $150 per ounce from its mines and development projects in Nevada, Mexico and Central America.
As of January 1, 2005 Glamis had proven and probable reserves of 6.3 million ounces of gold and 38.5 million ounces of silver. Common shares of Glamis Gold Ltd. trade under the symbol GLG on the New York and Toronto Stock Exchanges.

Investors should take a look at Glamis as a case study for successful Gold stock recipe. Traders might want to examine the charts of this strong momentum stock.

Glamis Gold Ltd,  GLG long term chart

Glamis Gold Ltd,  GLG chart

See spot Gold (XAU) and Silver (XAG) Charts here

Labels:

Amex Gold BUGS Index - HUI

Amex Gold BUGS Index - HUI chart


Amex Gold BUGS Index (HUI) Components as of: 04/07/06

GFI Gold Fields Ltd.
NEM Newmont Mining Corp.
FCX Freeport-McMoRan Copper & Gold Inc.
HL Hecla Mining
GLG Glamis Gold Ltd.
AEM Agnico Eagle Mines Ltd.
GOLD Randgold Resources Ltd.
MDG Meridian Gold Inc.
CDE Coeur d'alene Mines
KGC Kinross Gold Corp.
EGO Eldorado Gold Corp.
IAG Iamgold corp.
GG Goldcorp Inc.
HMY Harmony Gold Mining Co. Ltd.
GSS Golden Star Resources Ltd.

Labels: ,

Saturday, April 08, 2006

Lihir Gold Limited (LIHRY) & Gold / Australian $

Lihir Gold Limited is the owner and developer of one of the world's premier gold mines, located on Lihir Island in the New Ireland province of Papua New Guinea.
Lihir Gold Limited (LIHRY)
Dual listing:

LIHIR GOLD LTD ADR (NasdaqNM:LIHRY)

Lihir Gold Limited (LHG.ASX) Australian Stock Exchange (ASX 200 component)


Lihir Gold Limited (LHG.ASX) Australian Stock Exchange (ASX 200 component)
LIHIR GOLD LTD ADR (NasdaqNM:LIHRY)

Gold / Australian $

Labels: ,

Agnico-Eagle Mines Limited , AEM

Agnico-Eagle Mines Limited ,AEM is an international growth company focused on gold, with operations in Canada and advanced-stage projects and opportunities in Canada, Mexico, Finland and the U.S.A. Our LaRonde mine in Quebec is Canada's largest gold deposit. The mine generates strong earnings and cash flows, and is an excellent foundation for Agnico-Eagle's international expansion.


Agnico Eagle Mines Limited , AEM

Agnico Eagle Mines Limited. , AEM

Labels:

Friday, April 07, 2006

CBOE Gold Index Options GOX

The CBOE Gold Index is an equal-dollar weighted index composed of 10 companies involved primarily in gold mining and production. The index is re-balanced after the close of business on expiration Friday on the March quarterly cycle.
Multiplier: $100.
Strike Price Intervals: 5 points.
Strike Prices: In-, at- and out-of-the-money strike prices are initially listed. New series are generally added when the underlying trades through the highest or lowest strike price available.
Premium Quote: Stated in decimals. One point equals $100. The minimum tick for options trading below 3.00 is 0.05 ($5.00) and for all other series, 0.10 ($10.00).
Expiration Date: Saturday following the third Friday of the expiration month.
Exercise Style: European - GOX options generally may be exercised only on the last business day before expiration.
Last Trading Day: Trading in GOX options will ordinarily cease on the business day (usually a Thursday) preceding the date on which the exercise settlement value is calculated.

Index Components

(ABX) BARRICK GOLD CORP
(AEM) AGNICO-EAGLE MINES
(AU) ANGLOGOLD LIMITED
FCX FREEPORT MCMORAN (COPPER & GOLD )
GFI GOLD FIELDS LIMITED
(GG) GOLD Corp INC
(GLG) GLAMIS GOLD LTD
(KGC) KINROSS GOLD CORP.
(MDG) MERIDIAN GOLD INC.
(NEM) NEWMONT MINING CORP

Gold Index Options GOX charts

Labels: , ,

Thursday, April 06, 2006

Gold global perspective

Gold global perspective

Labels:

Gold Fields Limited (GFI) & Gold / S.A Rand ($zar)

Gold Fields Limited (GFI) is one of the world’s largest unhedged producers of gold. The company was formed in 1998 with the amalgamation of the gold assets of Gold Fields of South Africa Limited and Gencor Limited.
Gold Fields has attributable production of 4.2 million ounces per annum, mineral reserves of 64.8 million ounces and mineral resources of 174.5 million ounces. The company employs some 43,942 people including contractors across its operations and is listed in the JSE Securities Exchange South Africa (primary listing), New York Stock Exchange, London Stock Exchange, Euronext in Paris and Brussels as well as the SWX Swiss Exchange.

Technically GFI looks good, trading above the upper downtrend line , RSI & MACD are rising. Current Elliot wave count implies higher high will follow(v of 1).

Gold Fields Limited (GFI)chart

Ten years cup and handle pattern with an initial target of ~30$ .
Gold Fields Limited (GFI) chart

Gold in terms of South Africa Rand recently made a new multi year high, good support at 3500.

Labels: , ,

Wednesday, April 05, 2006

Hecla Mining Company (NYSE:HL) review

Hecla Mining Company (HL) was established in 1891 in northern Idaho’s Silver Valley.
Hecla is a lowest-cost primary silver producer in North America, producing 6 million ounces of silver at an average total cash cost of $2.96 per ounce in 2005. Hecla also produced 140,559 ounces of gold at an average total cash cost of $337 per ounce. The company has exploration properties and operating mines in five major world-class mining districts.

Like Coeur d'Alene Mines Corp. (CDE), Hecla is trading below the first Elliot wave high (2004). Obviously there is still some catch up to do before this veteran mining stock will get more attention.

Hecla Mining Company (NYSE:HL) chart

Hecla Mining Company (NYSE:HL) chart

Labels:

Tuesday, April 04, 2006

Coeur d'Alene Mines Corp. (CDE), (TSX:CDM) Review

Coeur d' Alene Mines Corporation (NYSE:CDE / TSX:CDM) is the world's largest publicly traded primary silver producer. In 2005, the Company produced almost 14 million ounces of silver and more than 130,000 ounces of gold at a cash operating cost of approximately $4.26 per ounce of silver.

Coeur has two of the largest silver mines in the U.S.; two expanding low-cost mines in southern Chile and Argentina; two low-cost mines in Australia and two advanced development projects, in Bolivia and Alaska. Coeur also owns large land positions around its two South American mines, where major exploration is ongoing in 2006.

The Company has no silver or gold production hedged.

CDE is certainly not the hottest silver stock you can find, CDE is still trading below the first Elliot wave high (Q1 2004). However the volume is decent and its worth to keep an eye on it and look for a possible entry point. Off course it all depends on the price of silver, but with silver going higher It will be reasonable to assume that Coeur d' Alene Mines Corporation will be able to surpass the Q1 2004 high.

Coeur d' Alene Mines Corporation (NYSE:CDE / TSX:CDM) chart

Coeur d' Alene Mines Corporation (NYSE:CDE / TSX:CDM) chart

Labels: ,