Tuesday, August 29, 2006

XAU index Fibonacci chart

Most markets (including gold, silver and mining stocks) have been range bound lately. Situations like this often resolve in powerful breakout one way or another…

Be prepared!

XAU gold and silver stocks index - chart

Labels: ,

Tuesday, August 22, 2006

VGZ, MNG - Charts

Technically, I like both VGZ and MNG .

Miramar Mining Corporation (AMEX: MNG),(TSE: MAE)

RSI trending up above 50, PPO trending up , PPO histogram positive. Trend line support at 3.30$ and rising, 50 DMA = pivot.. Triangle formation, resistance at 4.3$ expect a strong rally to 5.70$. and above if the stock can close above 4.30$ on decent volume.


Miramar Mining Corporation, mng chart


Vista Gold Corp. - VGZ (AMEX / TSX)

RSI trending up above 50, PPO trending up , PPO histogram natural. Trend line support at 9.50$ and rising, 50 DMA trending up, made a new long term high few days ago. Rising wedge formation – seems to break to the upside. – can quickly go to 15$ if the price of gold permits.


Vista Gold Corp., VGZ chart

Labels: , ,

Wednesday, August 16, 2006

HUI – Update

Not much change since the last HUI update. For gold exposure go for GLD, for gold stocks GDX / XGD. If you trade individual miners stocks - be sure to know what you are doing since individual companies are much riskier then gold or silver. I'm currently not in the business of promoting stocks and I do not recommend any of the stocks mentioned.

The daily chart is looking ok, RSI a bit below 50, PPO natural, triangle pattern. Support at 50 DMA and Fibonacci lines below current price. Resistance at Fibonacci lines above the current price.

hui gold bug index - daily chart

The weekly chart is looking good. RSI above 50, PPO natural.

hui gold bug index - weekly chart

Labels: ,

Thursday, August 03, 2006

GDX – Gold Miners ETF

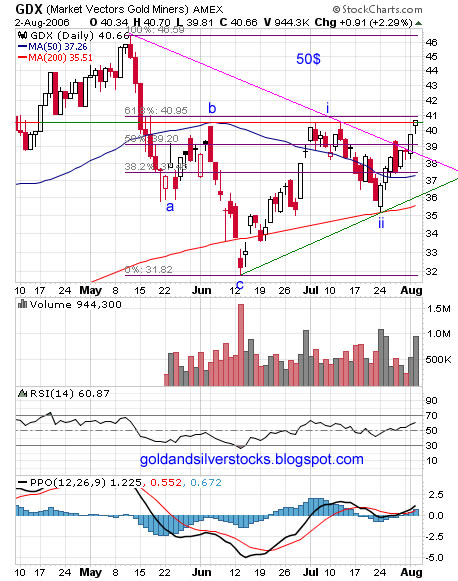
The GDX along the XGD is excellent trading / investment tool which enable both positive and negative diversified exposure to the gold mining industry.

Technically, breakout above the diagonal pink resistance line (currently support), slight resistance at the 61.8% Fibonacci line. Inverted head and shoulders pattern with price target of 50$. For practical objectives the same analysis is good for other gold miners indices.

Technical indicators: RSI trending up above 50, PPO bullish crossover, positive PPO histogram.

Support : Fibonacci lines below the current price , pink and green trend lines.

Resistance: 61.8% Fibonacci line, 43$ and the May high.

GDX – Gold Miners ETF chart

Labels: , , ,