Friday, June 30, 2006

NEM, FCX, CDE - Chart Reviews

Newmont Mining Corporation , NYSE : NEM

NEM - Typical A-B-C correction wave (59.59$ - 47.34$), went below the 200 DMA. Yesterday managed to break above the pink downtrend line, close above the 200 DMA and the 61,8% Fibonacci line. RSI trending up above 50, PPO positive crossover, PPO histogram positive, ADX bullish crossover. Nice candle on relatively high volume. Support at the 200 DMA, between 50$ to 51$ and at green support line. Resistance at the 50 DMA and Fibonacci appropriate levels.


NYSE : NEM chart


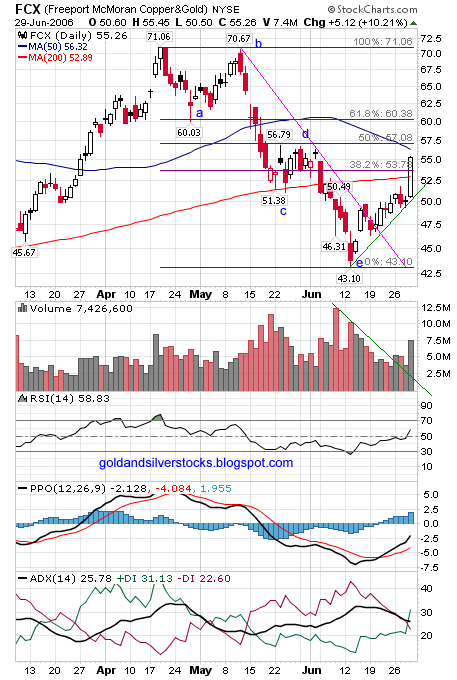
Freeport-McMoRan Copper & Gold Inc , NYSE : FCX

FCX – Topped early at mid April , had A-B-C-D-E correction wave(71.06$ - 43.10$), went below the 200 DMA then bounced sharply to close above the pink downtrend line. Currently above the first Fibonacci line just under the 50 DMA. Resistance at 50 DMA and Fibonacci levels. Support at the 200 DMA , Fibonnaci 38.2% level and green uptrend line. Big up day on good volume, RSI looking strong trending up above 50. PPO bullish crossover , PPO Histogram positive, ADX bullish crossover.


NYSE : FCX chart


Coeur d'Alene Mines Corporation , NYSE : CDE

CDE- A-B-C-D-E correction wave (7.37$ - 3.93$), currently still below the 200 DMA. Break up above orange downtrend line. Support at green uptrend line, Resistance at the 200 DMA. RSI trending up but still below 50, PPO positive crossover, PPO histogram positive, ADX Improving.

NYSE : CDE chart

Labels: , , , ,

Thursday, June 29, 2006

DROOY, KRY

J.R requested my opinion on two stocks:

DRDGOLD Limited, (NASDAQ:DROOY) and Crystallex International Corp. (AMEX; TSE: KRY)

DROOY – the stock have been underperforming gold and gold indices for quiet some time, it crashed to as low as 0.30$ then rallied to 2.02$. I recognize a potential head and shoulders pattern with a price target of about 0.40$. Currently trading below the 50 WMA (weekly moving average), RSI trending down below 50, PPO Bearish crossover, PPO histogram negative. Watch out if the support line (green) fails to hold.


DROOY chart


KRY- In less then a year the stock rallied from 1.01$ to as high as 6.25$ only to crash back to 2$. Currently trading below the 50 WMA, RSI trending down below 50, PPO bearish crossover, PPO histogram negative. If it goes under the 200 WMA then the green support line probably get tested.


KRY -Crystallex chart


Over all both charts are highly disordered reflecting extremely high risks!

See also : Special risks when investing in a mining company


If you want to suggest gold, silver or metal stocks for review - let me know

Wednesday, June 28, 2006

BGO, MNG, MGN Charts Review

Bema Gold Corporation – (TSE / AMEX: BGO), AIM: BAU

Bema – had the typical PMS A-B-C correction (6.33$ - 4.08$ ), break up above the downtrend line (orange). New uptrend = green line, RSI and Stochastic trading up. PPO crossover but still below zero, PPO histogram positive. Volume dried up.


The BGO label at the bottom of the post will take you to
previous related BGO posts.

BGO Chart


Miramar Mining Corporation (AMEX: MNG),(TSE: MAE)

Miramar – A-B-C-D-E correction (4.48$ - 2.84$), (note: E > C). Symmetrical triangle pattern between the orange line - resistance and green –support. RSI a bit above 50 with slight uptrend since mid May. PPO crossover and trending up above zero. Stochastic at overbought territory with possible bearish crossover.


MNG Chart


Mines Management, Inc. (AMEX: MGN)

MGN - A-B-C-D-E correction (10.10$ - 6.07$). Break up above downtrend line(orange) stopped just under 200 DMA. Volume collapsed to extremely low level. RSI still below 50, PPO crossover, PPO histogram positive, stochastic trending up.


NGN Chart

Labels: , , , ,

Tuesday, June 27, 2006

MDG, ABX, PAAS, AEM - Chart Analysis

MDG(NYSE), Meridian Gold Inc. MNG(TSE)

A-B-C correction (38.31 $ –25.86$), break up above downtrend resistance (orange line). Uptrend (green line), RSI above 50, PPO crossover, PPO histogram positive, ADX improving (almost positive).


MDG, Meridian Gold Inc. MNGChart


ABX (NYSE), Barrick Gold Corp. ABX(TSE)

A-B-C correction (35.90$ – 26.70$), break up above downtrend resistance (orange line).Uptrend (green lines), RSI improving, PPO minor crossover, PPO histogram slightly positive, ADX natural.


ABX, Barrick Gold Corp. Chart


PAAS (NASDAQ), Pan American Silver Corp. PAA(TSE)

PAAS lost synchronization with other PMs for some reason. PAAS topped earlier (March), A-B-C-D-E correction vs. A-B-C (27.28$ – 15.49$),at downtrend resistance (pink line). Slight uptrend (green line) , RSI improving , PPO crossover , PPO histogram positive , ADX natural.

PAAS Pan American Silver Corp. PAA Chart


AEM (NYSE), Agnico-Eagle Mines Ltd. AEM(TSE)

A-B-C correction (41.70 $ – 25.49$), break up above downtrend resistance (orange line).Uptrend (green line), RSI above 50, PPO crossover, PPO histogram positive, ADX improving.


AEM Agnico-Eagle Mines Ltd Chart


Free Elliot Wave Tutorial (For EWI club members).

Labels: , , , ,

Sunday, June 25, 2006

GG, SLW, AUY, TRE - Chart Analysis

GG(NYSE)- Goldcorp Inc. G(TSE)

A-B-C correction (41.02$ – 24.06$), bounced from the 200 DMA (daily moving average), break up above downtrend resistance (orange line). Slight uptrend (green line) , RSI improving , PPO crossover , PPO histogram positive , ADX natural.


gg chart


SLW(NYSE)- Silver Wheaton Corporation, SLW(TSE)

A-B-C correction (11.75 – 6.80), bounced from the 200 DMA, break up above downtrend resistance (pink line). Uptrend (green line), RSI improving above 50, PPO crossover, PPO histogram positive, ADX improving.


SLW chart


AUY(AMEX)- Yamana Gold Inc. YRI(TSE)

A-B-C correction (12.42 - 7.79), break up above downtrend resistance (green line). Uptrend (green line), RSI improving above 50, PPO crossover, PPO histogram positive, ADX improving.


TRE(AMEX)- Tanzanian Royalty Exploration, TNX(TSE)

A-B-C correction (9.10 – 6.09), closed above the( b) high & 61.8% Fibonacci level, at downtrend resistance (orange line). RSI above 50, PPO crossover, PPO histogram positive, ADX positive.


tre chart

Labels: , , , ,

Friday, June 23, 2006

Gold Fields (GFI), Harmony Gold Mining (HMY)

It might be worth to look at South African miners like HMY & GFI which seems to lead right now probably due to Rand weakness.

Technically both charts of Harmony and Gold fields are showing a couple of bullish signs: Closed above the down trend resistance and 38.2% Fibonacci level on fine volume, RSI trending up above 50 ,PPO crossover & Improving ADX.

Gold Fields (GFI)chart


Harmony Gold Mining (HMY)chart

Labels: , , ,

Thursday, June 22, 2006

HUI – Buy Signals

HUI – the AMEX Gold Bugs Index is a basket of relatively unhedged gold miners. Gold Indices like the HUI tend to lead the price of gold. Technically I observe three buy signals on the short term daily chart:

1) Diagonal downtrend line (previous resistance) is broken to the upside.
2) RSI downtrend line is broken.
3) PPO Histogram showing positive divergence.

So, unless the A-B-C correction develops into A to E correction (unlikely) it is reasonable to assume that the HUI is headed higher. The May top (401.69) will get tested and Higher high is certainly a possibility.

The technical situation of other gold indices (XAU, GOX & GDM) is similar. Investors and traders can get exposure to gold mining equity with the GDX ETF.

Browse Gold and Silver Mining Stocks blog Archive. See gold and silver charts and commentary. Visit commodities blog.

AMEX Gold Bugs Index(HUI)

Labels: , ,

Wednesday, June 21, 2006

Gold Stocks ETF GDX & XGD

GDX is the Market Vectors Gold Miners ETF which tracks the GDM – AMEX Gold Miners Index. XGD is the iShares Canadian Gold Sector ETF which tracks the S&P/TSX Gold Index. Both ETFs allows investors and traders to gain diversified gold mining equity exposure. The main differences are: The XGD trades on the Canadian Toronto stock exchange and is priced with Canadian dollar while the GDX trades on the American stock exchange – AMEX and priced with US Dollar.

Long term (weekly chart) the XGD retraced about 61.8% of its recent up leg (wave 1) and bounced of the 2003 high. The GDX retraced about 50% of its recent up leg (wave 1) and bounced from the 50 weekly moving average zone.


Short term both GDX and XGD had a A – B –C correction (wave 2) , resistance at the diagonal line – I expect a strong rally once the trend line is broken.

For free (needs short registration) Elliott wave tutorial see EWI.


XGD ETF weekly chart

GDX ETF weekly chart

XGD ETF daily chart

GDX ETF daily chart

Labels: , , , ,

Sunday, June 18, 2006

Gold vs. Gold Stocks, GOLD/XAU Ratio

Gold Stocks as a group or an index tend to be more volatile then gold. When gold is going up gold stocks tend to go up faster, when gold is correcting downwards , gold stocks get hit harder. Overall Gold & gold indices are well correlated. This can be easily seen on the first chart below which presents the last 3 year performance of Gold, The Philadelphia Gold & Silver Index (XAU) and the ratio between them. When the Gold / XAU is trending down both Gold & the XAU Index are trending up and visa versa.

The usefulness in charting the GOLD/XAU ratio is dual – the ratio can sometimes give an early sign and confirmation of bottom or top for the Gold market complex. Looking at the second chart below (Seven month $GOLD:$XAU daily candle chart) you can see a relatively clear double top pattern which implies that the gold market have bottomed.

Please note: The GOLD/XAU Indicator have served me in the past but I do expect it to stop working sometimes in the future - Gold and Silver will outperform the stocks at some point. Remember that gold stocks are highly dependent on the price of gold while the opposite is not true.

I choose the Philadelphia Gold & Silver Index (XAU) for the reason it is the most popular - traded gold stocks index. The same conclusions are generally true for other gold indices like the GDM (GDX ETF) – AMEX Gold Miners Index, the HUI – AMEX Gold Bugs Index and the GOX – CBOE Gold Index.

By the way and In case you wanted to know my favorite gold stock is the GLD.

Gold vs. Gold Stocks

GOLD/XAU Ratio

Labels: ,

Monday, June 12, 2006

SILVER WHEATON (SLW) & Royal Gold (RGLD)

The sharp and quick gold & metals correction is coming to an end. The precious metals stocks complex was hit hard the last couple of weeks and probably good buying opportunities are all around.

Royal Gold and Silver Wheaton are stocks that usually tend to recover quickly, I suggest to follow them closely for a potential nice bounce.

Royal Gold (RGLD) is close or already completed ABC correction after 5 waves up, the price is close to 2 years up trend line.

Silver Wheaton (SLW) was hammered strongly to as low as 7.21$ - this bottom should hold. Strong rally will follow once the short term trend line is broken.

SILVER WHEATON (SLW)

Royal Gold (RGLD)

Labels: , , ,

Thursday, June 08, 2006

Gold Stocks Indices: XAU, HUI, GDM (GDX)

PHLX Gold & Silver Sector, XAU

Amex Gold Bugs Index, HUI

Amex Gold Miners Index , GDM - tracked by the GDX Market Vectors-Gold Miners ETF.

All Three main Indices looks similar, ~50% correction and bounced slightly - Fibonacci magic?

XAU weekly chart

HUI weekly chart

GDM (GDX) weekly chart

Labels: , , , ,

Tuesday, June 06, 2006

Europe largest gold mine to be opened in Finnish Lapland

The largest gold mine in Europe is to be opened in Finnish Lapland. The Canadian mining company Agnico-Eagle has decided to start excavation of a gold deposit in the Suurikuusikko area of Kittilä.
The topsoil is already being removed from what will be an open-pit mine. The construction of a gold refinery is also scheduled to begin this summer. Test drilling has been going on in the area since 1998.
The Suurikuusikko deposit is known to contain at least three million ounces of pure gold. Geologists say that there could be even more gold ore deeper in the ground. The world market price of gold has been rising recently; one ounce, which is about 31 grammes, is currently worth more than 600 US dollars.

The mine is expected to help create more than 200 jobs in the area for at least 13 years before the deposit is exhausted.
Heino Alaniska of Agnico-Eagle, says that preparations to open the mine have been underway for a long time. He was hired by the Canadian company a year ago. Previously he had worked in Sodankylä as the local head of the Pahtavaara gold mine, owned by the Swedish company Scan Mining.
"Opening the mine requires many kinds of construction and road work, which will employ at least 300 people for about two years. In addition, the company will hold an event in a couple of weeks to recruit people to work at the mine", says Kittilä’s municipal mayor Seppo Maula.
Kittilä has also mapped out properties for housing for outsiders moving to the area to work at the mine. Kittilä gets most of its revenue from tourism, and the gold mine is seen as an effective way of diversifying the business structure.

Two years ago Agnico-Eagle acquired ownership of the shares of the Swedish Riddarhyttan Resources, which had previously studied the Kittilä deposit. Since then, the company has spent nearly EUR 10 million on test drilling and other studies.
"Opening the mine has hinged on finding the right refining method", says deputy CEO Ebe Scarcest, who visited the area in December.
The gold in the deposit is not in nuggets visible to the naked eye, which could be extracted mechanically by panning or sluicing. The ore in question requires more complicated refining methods. Original plans were for a method involving the use of bacteria, but Agnico-Eagle opted for a more traditional pressure method, which is more expensive, but it is also more environmentally friendly, as it uses less cyanide. -source

Labels: , ,

Monday, June 05, 2006

Randgold Resources Ltd. (Nasdaq: GOLD)

Randgold Resources - one of the few NASDAQ gold stocks, Randgold had a healthy pullback, two years trend line support still in place. Short term consolidation pattern around 100 DMA , buying opportunity around 18$ if it even get there.


See Elliott Wave International Fresh New Crash Course - (You will have to register for EWI club -FREE!)

Randgold Resources Ltd. (Nasdaq: GOLD) weekly chart


Randgold Resources Ltd. (Nasdaq: GOLD) daily chart

Labels: