GDX – goldminers ETF Charts
GDX is currently the most diversified golminers trading instrument.
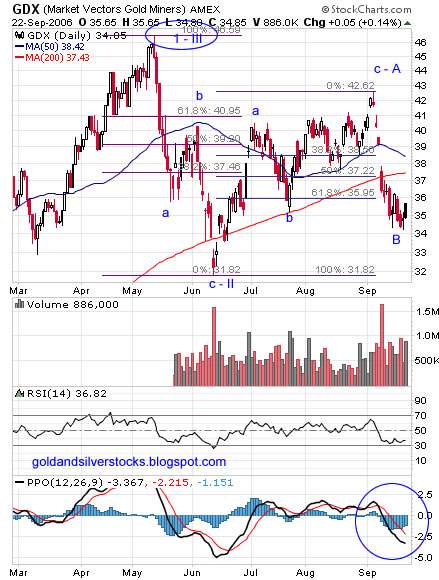
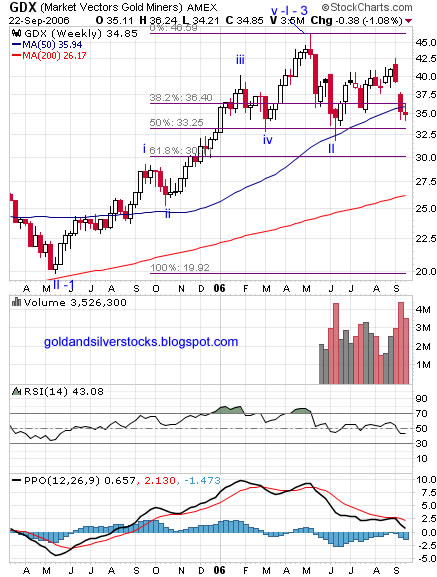
Technically the GDX is trapped between the May high (46.59$) and the June low (31.82$). I annotated the charts with Fibonacci support/ resistance levels and Elliott wave count. If the wave count is correct then the GDX will soon head back up and the last low (labeled B) should probably hold.
The PPO indicator on the daily chart is sowing signs of turning back up. On the Weekly chart the PPO is still above zero.
Labels: Elliott Wave, Fibonacci, GDX
posted by troy @ 9/24/2006
0 comments
![]()
![]()