Friday, June 23, 2006

Gold Fields (GFI), Harmony Gold Mining (HMY)

It might be worth to look at South African miners like HMY & GFI which seems to lead right now probably due to Rand weakness.

Technically both charts of Harmony and Gold fields are showing a couple of bullish signs: Closed above the down trend resistance and 38.2% Fibonacci level on fine volume, RSI trending up above 50 ,PPO crossover & Improving ADX.

Gold Fields (GFI)chart


Harmony Gold Mining (HMY)chart

Labels: , , ,

Saturday, May 20, 2006

Few Gold, Silver stocks charts for the weekend

Silver Wheaton Corp.(NYSE:SLW)

The SLW label at the bottom of the post will take you to possibly related Silver Wheaton previous posts.

SLW @ Google Finance

SLW @ Yahoo Finance

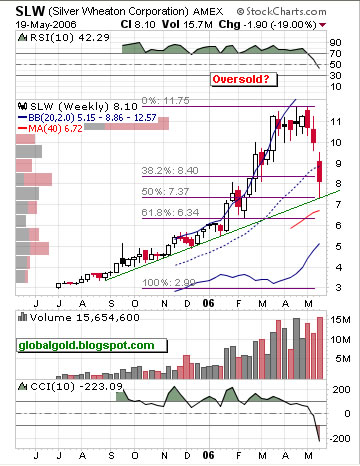
Silver Wheaton weekly chart , Fibonacci support levels. If SLW is not oversold I don't know what it is... 50% hair cut.

slw chart


**************************************

Meridian Gold Inc. (NYSE:MDG)

Meridian Gold Inc. SEC reports

MDG @ Yahoo Finance

MDG @ Google Finance

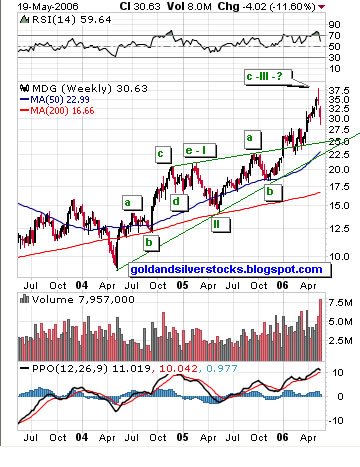
Meridian Gold Inc. weekly chart Elliott wave count

mdg chart


***************************************

Gold Fields Limited (ADR) (NYSE:GFI)


GFI @ Google Finance

GFI @ Yahoo Finance


Gold Fields weekly chart, Fibonacci support levels

gfi chart


*************************************

Labels: , , , ,

Thursday, April 06, 2006

Gold Fields Limited (GFI) & Gold / S.A Rand ($zar)

Gold Fields Limited (GFI) is one of the world’s largest unhedged producers of gold. The company was formed in 1998 with the amalgamation of the gold assets of Gold Fields of South Africa Limited and Gencor Limited.
Gold Fields has attributable production of 4.2 million ounces per annum, mineral reserves of 64.8 million ounces and mineral resources of 174.5 million ounces. The company employs some 43,942 people including contractors across its operations and is listed in the JSE Securities Exchange South Africa (primary listing), New York Stock Exchange, London Stock Exchange, Euronext in Paris and Brussels as well as the SWX Swiss Exchange.

Technically GFI looks good, trading above the upper downtrend line , RSI & MACD are rising. Current Elliot wave count implies higher high will follow(v of 1).

Gold Fields Limited (GFI)chart

Ten years cup and handle pattern with an initial target of ~30$ .
Gold Fields Limited (GFI) chart

Gold in terms of South Africa Rand recently made a new multi year high, good support at 3500.

Labels: , ,